Stock Demand Trends and Forecast v.18
The tool to calculate stock demand trends and make predictions for future demand statistically
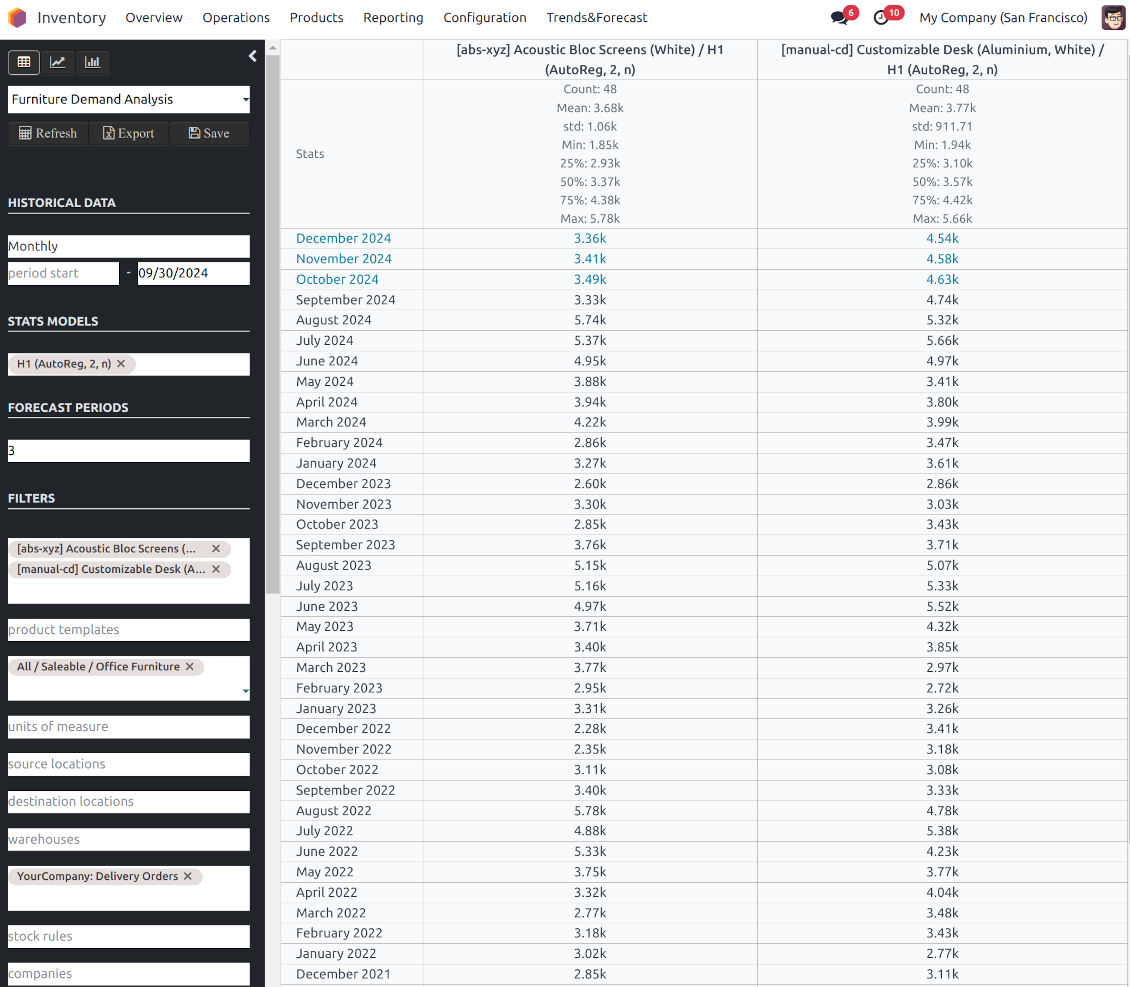
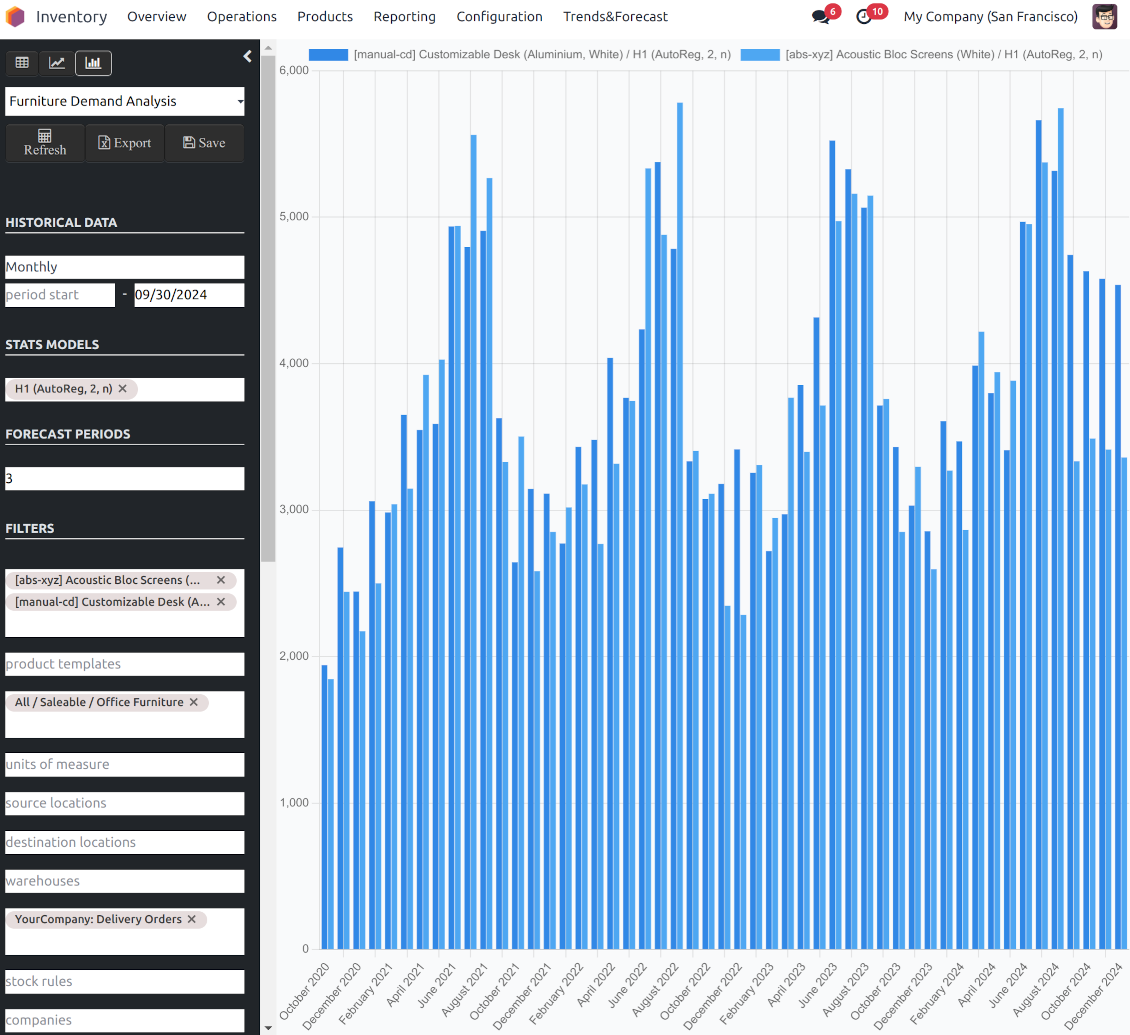
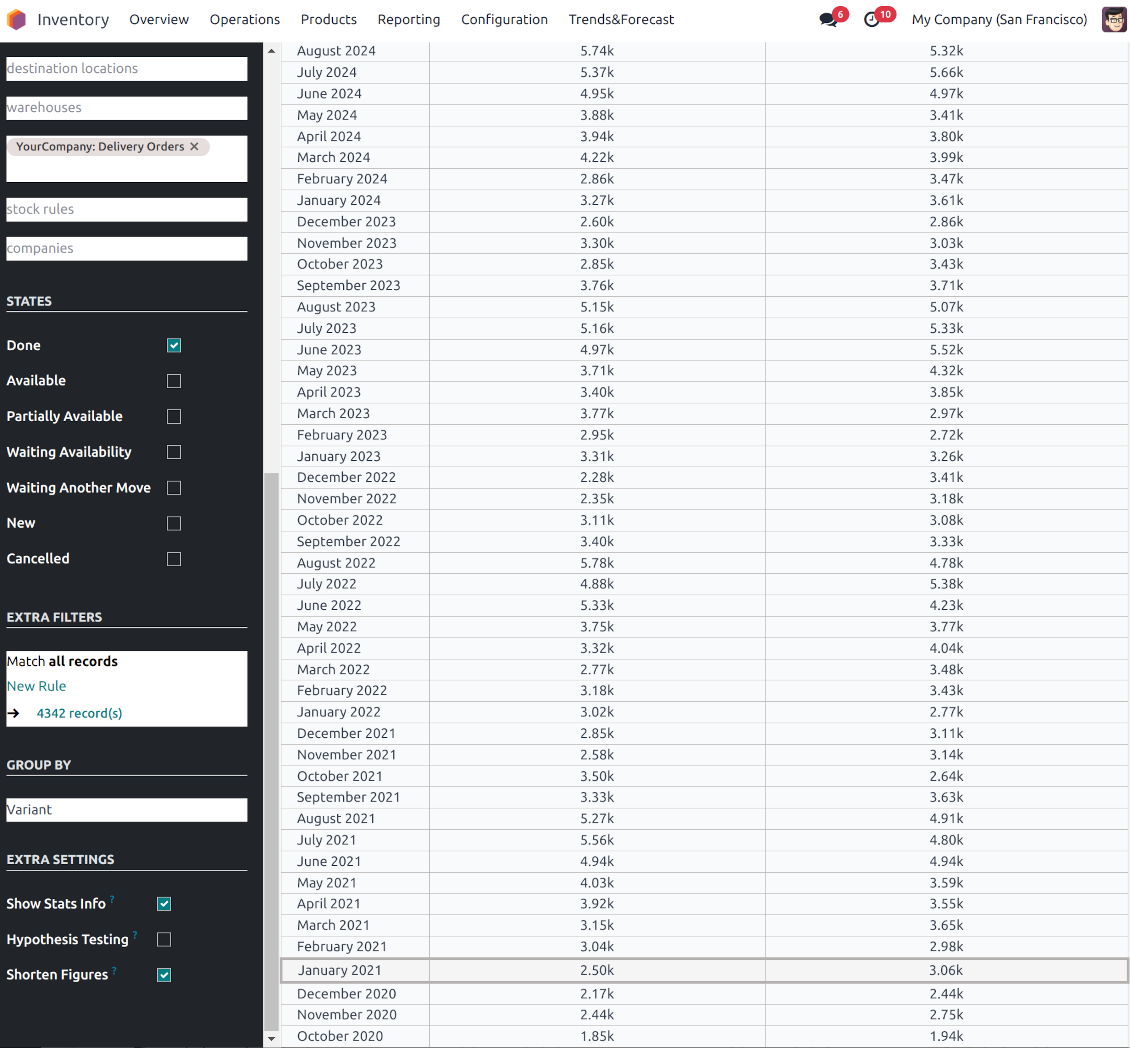
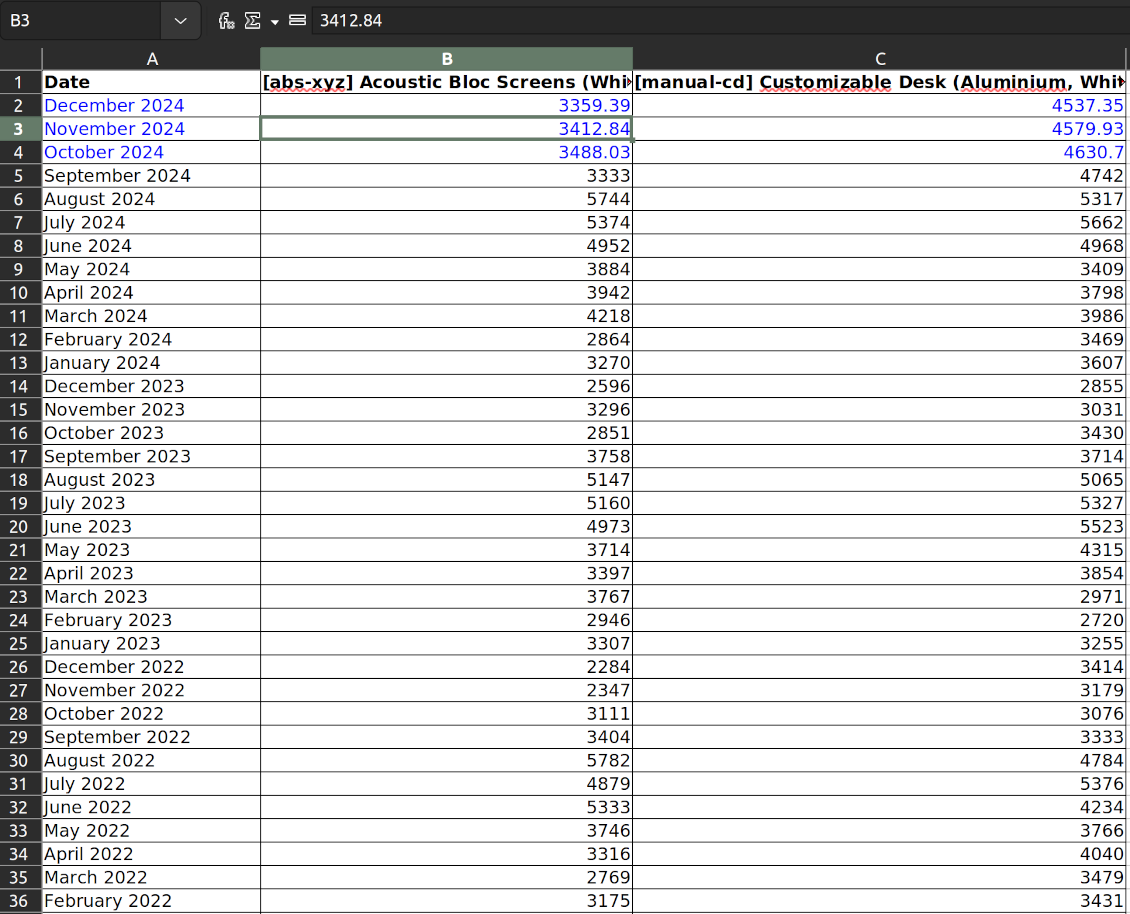
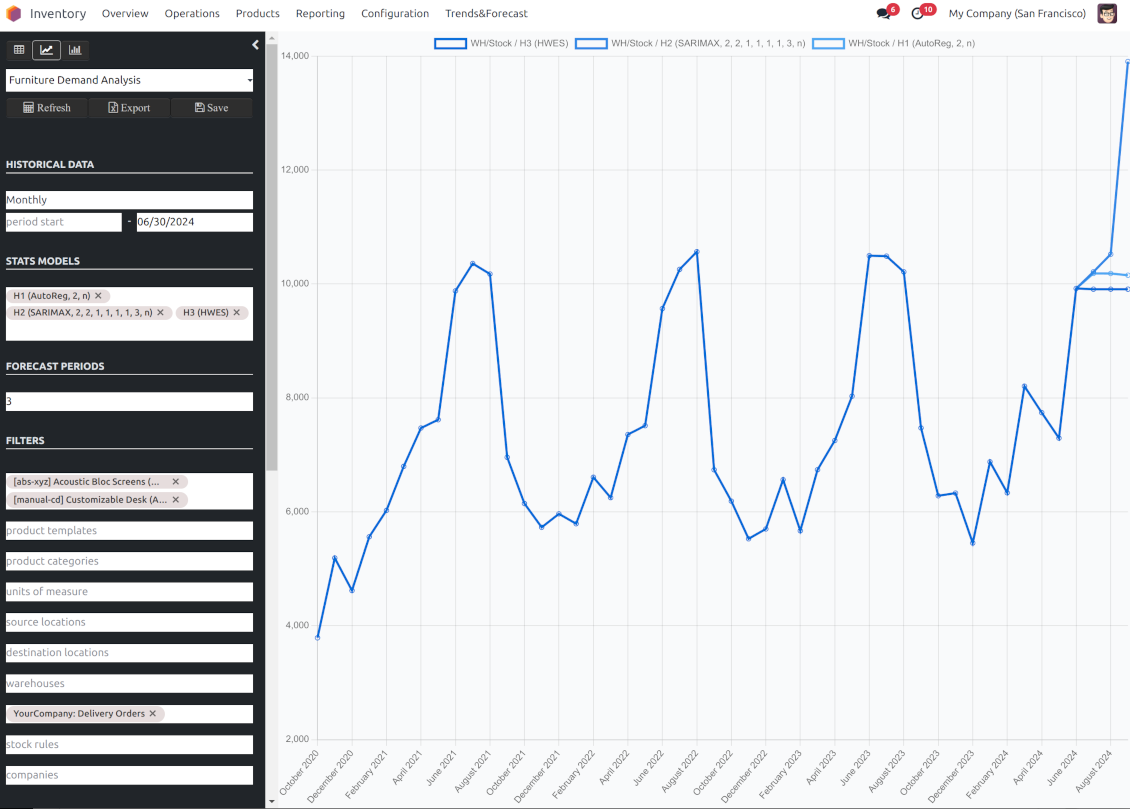
If you knew the stock demand trends of your warehouses, you would have a clue to decrease keeping costs and have a flawless supply chain. Regretfully, you can't know the future. However, you can predict it with a certain reliability. This is an Odoo tool for that goal. The app lets you construct stock demand by periods and forecast scientifically further demand based on the Python library statsmodels.
The scientific approach to forecasting
The app assumes applying statistical methods to calculate historical trends and make a forecast. Experiment with statistical models and parameters to achieve the most reliable prediction. Leverage the proven statsmodels methods
Innovative data analysis interface
The tool introduces a special interface to instantly calculate series. Flexibly switch between different reports and update settings in a few clicks. Control data in pivot, graph, or chart views. Export series as an Excel tabled
Focused analysis
Shrink considered stock operations flexibly or analyze global company inventory demand. Group data into various series
Topical data
Apply time frames for historical data and work with intervals that are of interest to your industry. Work with past and future periods.
Flexible report configuration
-
Introduce as many analytic reports as you need. Each report is based on Odoo's stock moves' data
-
Keep reports to re-use them, instantly switch between reports, or experiment with real-time changes without saving those
-
Show historical and forecast series as a table, line graph, or bar chart, or export data as an Excel table
-
Apply as many and as different statistical models as you want to check. Each stats model will peer its own data series and prediction if the latter is possible. See also the section "Statistical models"
-
Define the data periods under analysis by entering a start and end. Only inventory data within this interval will be included in the series
-
Split data series into years, quarters, months, weeks, and days depending on seasons assumed in your industry or business area
-
Select an unlimited number of periods to predict future periods or check hypotheses
-
Grant the right to forecast tools for any WMS user (the group Inventory > Stock Demand Forecast)
-
Filter stock data by product variants, product templates, product categories, units of measurement, source or destination locations, warehouses, operation/picking types, stock rules, and companies (for multi-company regimes). Introduce your own criteria based on Odoo's dynamic domain constructor, so shrink analysis by any stock move storable fields
-
Introduce a few data series simultaneously with grouping by a product variant, a unit of measurement, a source or destination location, a warehouse, a stock move state, an operation type, a stock rule, or a company. Take into that if the report assumes products with different units of measurement, the grouping will be possible only by the units or by variants
-
Hide/show general statistical measurement of series: count, mean, standard deviation, minimum, maximum, 25%, 50%, and 75% factors
-
Optionally compare predicted values to real historical data if any. See also the section "Hypothesis Testing"
-
Make figures human readable (e.g. 192,217 as 200k) or show them precisely.
Statistical models
-
The tool allows calculating inventory demand trends based on predefined statistical models introduced by the Python package statsmodels
-
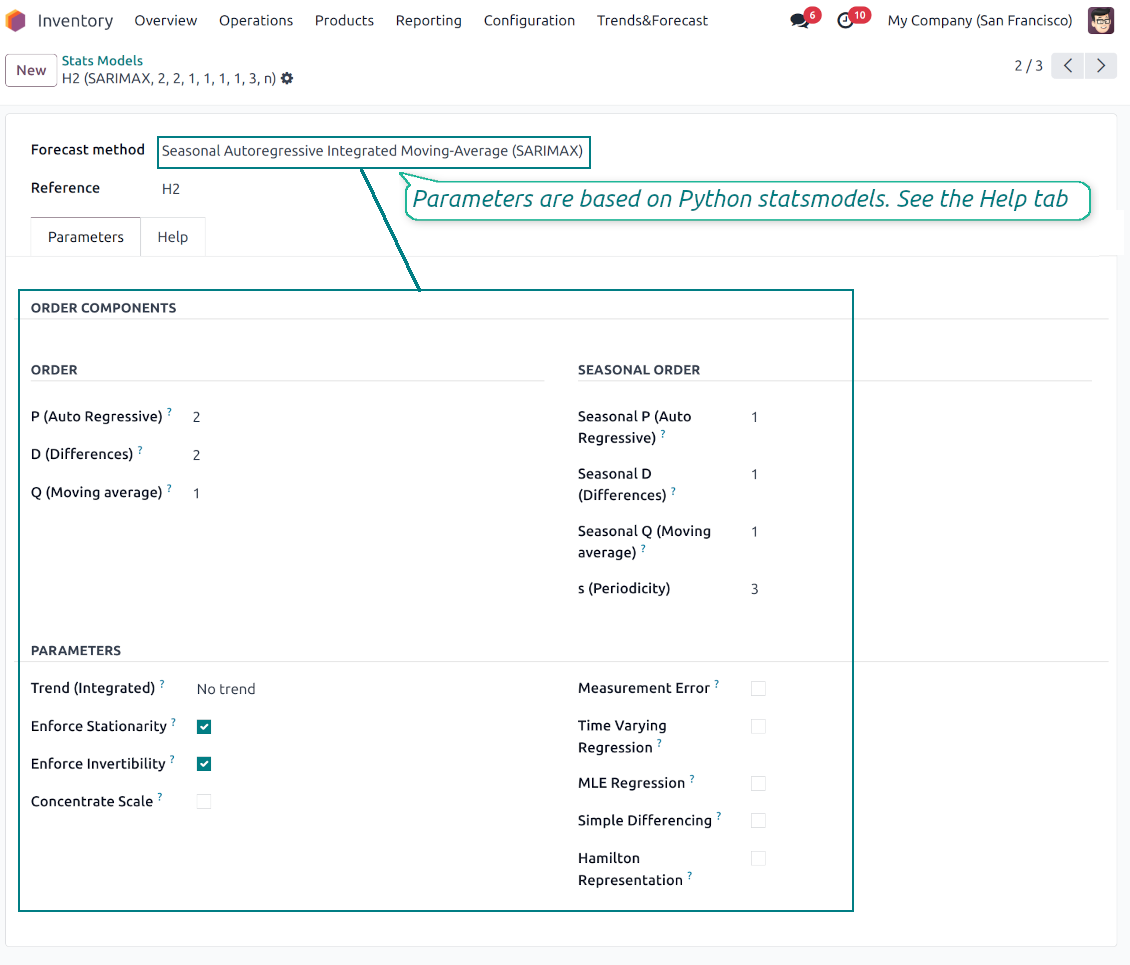
Methods have different complexity, and their own unique parameters, and might be suitable for a definite market or a specific business. The final choice of the model and related statistical parameters is only up to you. Nobody except you can better understand tendencies in your company inventory demand, and hence which methods and factors should be applied
-
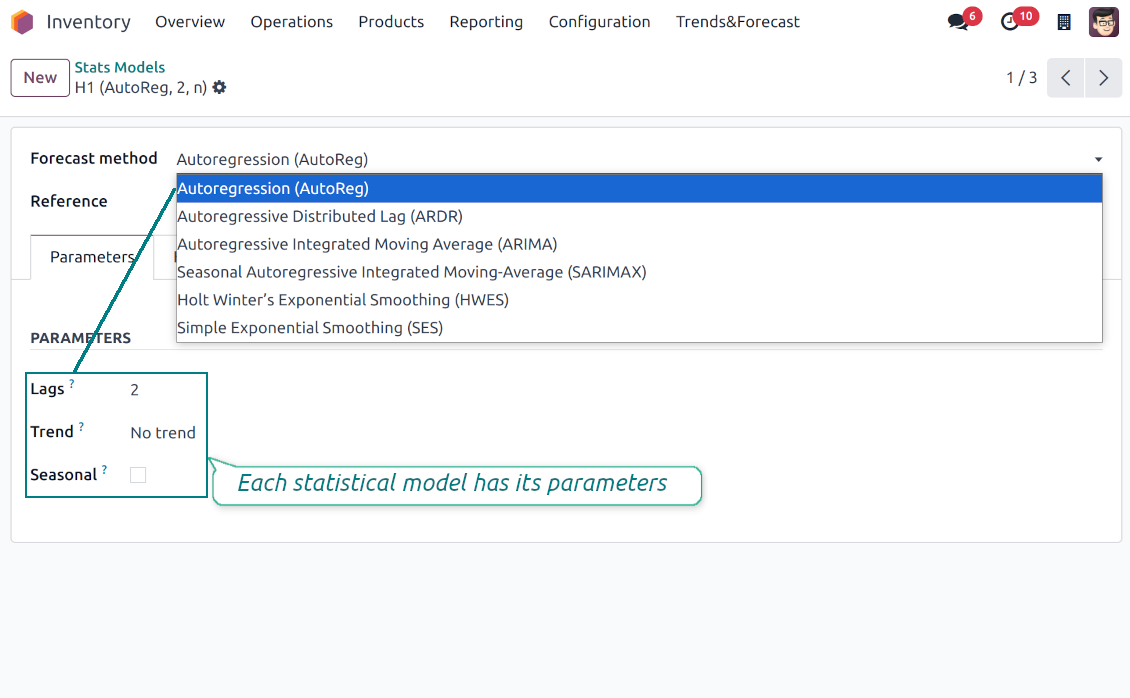
Available statistical models are Autoregression (AutoReg), Autoregressive Distributed Lag (ARDR), Autoregressive Integrated Moving Average (ARIMA), Seasonal Autoregressive Integrated Moving-Average (SARIMAX), Holt Winter's Exponential Smoothing (HWES), Simple Exponential Smoothing (SES)
-
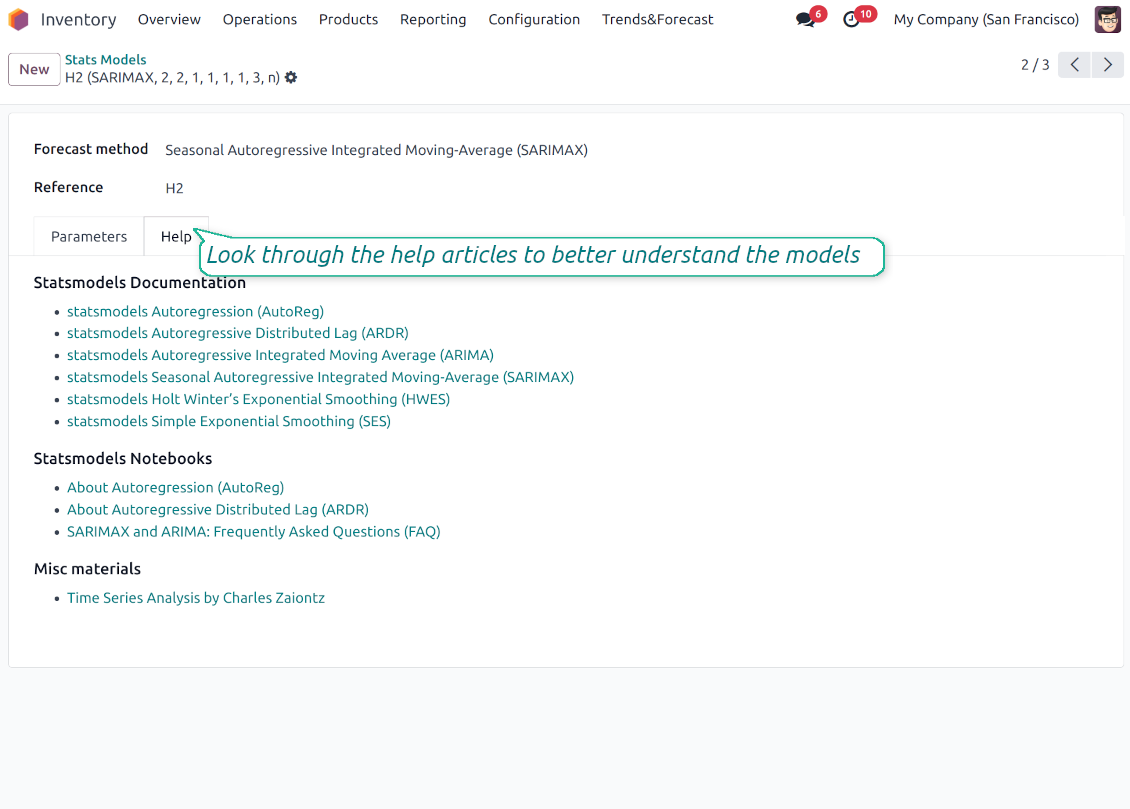
For deep details about what each stats model means and which parameters might be applied, look through the tab "Help" on the stats model form
-
Keep and use an unlimited number of stats models with various parameters. Check, compare, and update those flexibly through the forecast manager interface
-
Often models with specific parameters will not result in any prediction or the prediction will be unrealistic. This is normal, only a deep understating of trends and much experimenting might give a viable forecast for your specific case.
Hypothesis Testing
-
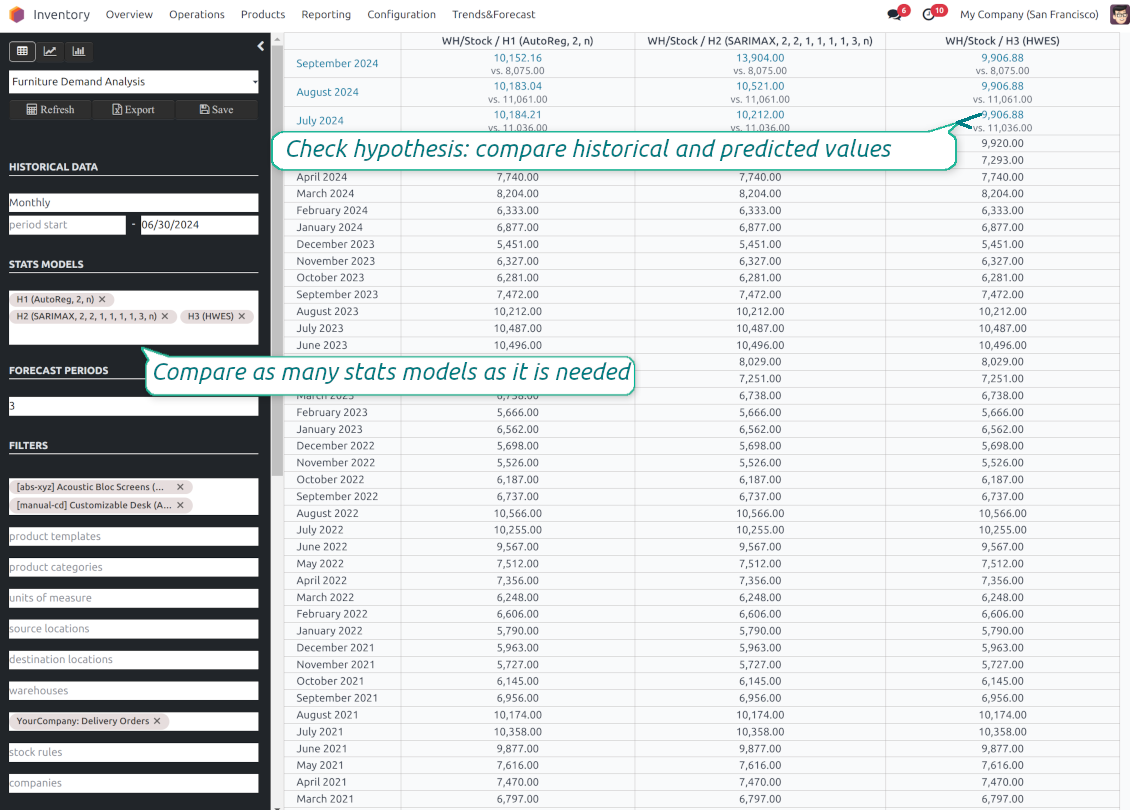
To get a proper prediction, it is usually needed to experiment a lot with statistical models and introduced parameters. To check the results, the app allows compare forecast data with real values
-
To check a certain assumption with historical values, you may make an analysis and prediction for some past periods, and turn on the setting "Hypothesis testing"
-
For example, you have stock moves from 2017 to 2022. Then, you can get report historical data for 2017-2021, and make the forecast for 12 months of 2022. In this way, you will get the prediction for the interval for which you already have actual values. By comparing forecast and actual values, you can decide whether a chosen model and factors are good enough
-
The app allows checking the hypotheses for a few stats models simultaneously. In this way, it is possible to reveal what is actually the most appropriate, or whether experimenting should be continued.
Usage requirements
-
To reveal trends, there should be enough historical stock moves data. It is senseless to make a forecast based on the last 5 days of operations since no trend cannot be retrieved. Take into account that data should be enough for the chosen filters and for each grouped series
-
There should be not only enough stock moves but also there should be some actual trends. Chaotic data will not result in reliable predictions. To use the app, you should understand which assumptions (e.g. seasonal changes) you check
-
To use the app, you either should have a clear understanding of how statistics works or a will to understand that. Regretfully, there is no way to make a "general" analysis, each specific case is unique and requires its own elaboration.
구성 및 설치 팁: Stock Demand Trends and Forecast Odoo v.18
Python dependencies
To guarantee the tool works correctly, a number of Python libraries are required: pandas, numpy, statsmodels, scipy, xlsxwriter. To install those packages execute the command:
pip3 install pandas numpy statsmodels scipy xlsxwriter
If you run Odoo on Python prior to or equal to version 3.7, please install the following versions of the packages pandas==1.3.5, statsmodels==0.13.1
Server memory limits
Running the statistical analysis and making the forecast is quite a resource-demanding operation. If users face the hanging interface, make sure that server memory limits and timeouts are enough. Otherwise, increase those settings.
관련 자주 묻는 질문 Stock Demand Trends and Forecast Odoo v.18
도구의 업데이트 정책은 무엇입니까?
현재 Odoo Apps Store 정책에 따르면:
- 버전 12.0 이하용으로 구매한 모듈은 12.0까지의 모든 버전에 접근할 수 있습니다.
- 버전 13.0부터는 모듈 버전마다 따로 구매해야 합니다.
- 버전과 관계없이 구매하면 해당 메이저 버전 내의 모든 업데이트와 버그 수정 권한이 있습니다.
faOtools 팀은 해당 정책을 통제하지 않습니다. 문의는 Odoo Apps Store 담당자에게 직접 하세요.
앱을 Odoo.sh에 어떻게 설치하나요?
가장 단순한 방법은 Odoo 스토어의 기본 제공 워크플로를 사용하는 것입니다:
1. 모듈 페이지를 열고 Deploy on odoo.sh 버튼을 클릭합니다.
2. 그러면 GitHub 페이지로 이동합니다. 계정에 로그인한 뒤 'Create a new repo'를 클릭하거나 기존 저장소를 사용하세요. 저장소는 비공개여야 합니다. OPL-1 라이선스 앱을 공개하는 것은 허용되지 않습니다. 필요하면 Odoo.sh 프로젝트용 새 repo를 만드세요.
3. 그런 다음 odoo.sh로 가서 Deploy 버튼을 클릭합니다. 팝업에서 결정을 제출하고 'Continue.'를 클릭합니다. 그러면 설치가 시작됩니다.
이 단계로 프로젝트의 프로덕션 브랜치에 앱이 설치됩니다. 다른 브랜치에 앱을 배포하거나 모듈을 업데이트하려면 다음을 수행하세요:
1. Odoo 스토어에서 앱 소스 코드를 업로드합니다.
2. 모듈을 필요한 GitHub 저장소에 커밋합니다. 앱 폴더/파일이 무시되지 않는지 확인하세요(즉 repo의 .gitignore에 넣지 마세요). 저장소는 odoo.sh가 자동 생성하며 기본적으로 중요한 항목(예: /lib)이 포함될 수 있습니다. 모듈의 모든 디렉터리, 하위 디렉터리, 파일을 예외 없이 업로드하세요.
3. odoo.sh 프로젝트의 대상 브랜치를 Deploy하거나, 설정이 그렇게 되어 있으면 자동 빌드될 때까지 기다립니다.
자체 서버에 앱은 어떻게 설치하나요?
2. Odoo 서버를 다시 시작합니다;
3. 개발자 모드를 켭니다(기술 설정);
4. 앱 목록을 업데이트합니다(앱 메뉴);
5. 앱을 찾아 'Activate'/'Install'을 누릅니다;
6. 앱 페이지에 안내가 있으면 따릅니다.
앱에 추가 기능이 있는 것을 봤습니다. 나중에 구매해도 되나요?
네, 물론입니다. 동시에 Odoo가 모든 의존성을 장바구니에 자동 추가하므로, 이중 결제를 피하려면 이미 구매한 도구를 제외하십시오.
앱을 Odoo.sh에 배포했는데 테스트에서 경고/오류가 보입니다
빨강/주황 경고는 앱 기능에 영향을 주지 않습니다. 안타깝게도 표준 자동 테스트가 앱 목표와 충돌하는 동작을 가정해 모듈이 통과하지 못할 때가 있습니다. 예를 들어 우리는 가격 계산을 바꾸는데, 표준 Odoo 모듈 테스트는 최종 가격을 표준 알고리즘과 비교합니다.
먼저 배포된 데이터베이스 기능이 정상인지 확인하십시오. 모두 올바르게 동작합니까?
그래도 경고가 실제 기능에 영향을 준다고 생각되면 연락해 주시고 전체 설치 로그와 배포된 모듈 전체 목록(코어 및 서드파티 포함)을 보내 주십시오.
앱을 귀사에서 직접 구매할 수 있나요?
아니요, 도구는 오직 공식 Odoo 앱 스토어.
할인을 받고 싶습니다
유감스럽게도 개별 가격을 제공할 기술적 수단이 없습니다.
Odoo Online (SaaS) 데이터베이스에 앱을 설치할 수 있나요?
아니요, 서드파티 앱은 Odoo Online에서 사용할 수 없습니다. 유감스럽게도 Odoo SaaS가 이를 차단합니다.
도구가 다른 앱에 의존합니다. 그것도 구매해야 합니까?
예, 도구가 올바르게 동작하려면 의존성에 표시된 모든 모듈이 필요합니다. 앱 페이지의 가격에는 필요한 의존성이 이미 포함되어 있습니다.
모듈의 미국 달러 가격은 얼마입니까? 왜 바뀌었습니까?
모듈 가격은 유로로 책정됩니다. Odoo 스토어는 내부 환율에 따라 다른 통화로 변환합니다. 따라서 환율이 갱신되면 미국 달러 가격이 바뀔 수 있습니다.
영어 이외 언어의 앱·웹사이트 문구는 AI 지원으로 작성되며 공식 Odoo 번역과 맞춥니다. 오류를 발견하시면 번역 정확성 티켓을 보내 주세요 그러면 수정하겠습니다.
Odoo 데모 데이터베이스(라이브 미리보기)
이 앱에는 무료 맞춤 데모 데이터베이스를 제공할 수 있습니다.
문의에 전화번호나 신용카드가 필요 없습니다. 30초가 넘지 않는 짧은 이메일 가입만 하면 됩니다.
요청하시면 개별 라이브 미리보기 데이터베이스를 준비합니다. 약 2주 동안 테스트를 하고 가정을 확인할 수 있습니다.
버그 신고
버그나 일관되지 않은 동작을 발견하면 주저 말고 문의하세요. 구매 후 60일 이내 수정을 보장하며, 그 이후에도 도구를 개선하는 데 관심이 큽니다.
문의에 전화번호나 신용카드가 필요 없습니다. 30초가 넘지 않는 짧은 이메일 가입만 하면 됩니다.
요청에 가능한 한 많은 세부정보를 포함하세요: 스크린샷, Odoo 서버 로그, 문제 재현 방법의 전체 설명 등. 일반적으로 이슈에 대한 작업 계획 준비(버그가 확인된 경우) 또는 수행 지침 제공(그 외의 경우)에는 영업일 기준 며칠이 걸립니다.
공개 기능 요청 및 모듈 아이디어(무료 개발)
도구를 개선하려는 동기가 강하며 어떤 피드백이든 감사드립니다. 요구 사항이 공익에 맞고 효율적으로 구현될 수 있다면 팀이 할 일 목록에 넣습니다.
이런 할 일 목록은 정기적으로 처리되며 추가 요금이 없습니다. 기한과 최종 디자인을 약속할 수는 없지만, 투자와 위험 없이 원하는 기능을 얻는 좋은 방법이 될 수 있습니다.
문의에 전화번호나 신용카드가 필요 없습니다. 30초가 넘지 않는 짧은 이메일 가입만 하면 됩니다.
18.0.1.0.9
- The bug with pandas compatibility has been fixed.
18.0.1.0.8
- 거의 보이지 않던 필터 문제가 수정되었습니다.
18.0.1.0.7
- 번역되지 않은 경고 문제가 수정되었습니다.
18.0.1.0.6
- 비활성 레코드용 Archived 리본이 모델 및 저장된 보고서 폼 보기에 추가되었습니다.
18.0.1.0.5
- 앱이 버전 18으로 게시되었습니다.
17.0.1.0.6
- 분석 알고리즘이 불필요한 읽기를 없애도록 최적화되었습니다.

Odoo 첨부 파일을 폴더로 유연하게 구성하고 Google Drive, OneDrive/SharePoint, Nextcloud/ownCloud, Dropbox, Amazon S3, Box, NAS와 디렉터리를 동기화하는 도구. DMS. 파일 관리자. 문서 관리 시스템
398€

The tool to build a deep and structured knowledge base for internal and external use. Knowledge System. KMS. Wiki-like revisions.
398€
The tool to automatically synchronize Odoo attachments with OneDrive files in both ways
487€
The tool to set up KPI targets and control their fulfillment by periods. KPI dashboards. Dashboard designer. KPI charts

The tool for time-based service management from booking appointments to sales and reviews
398€
The tool to automatically synchronize Odoo attachments with Google Drive files in both ways
487€
The tool to configure variant prices based on attributes coefficients and surpluses
98€