Stock Demand Trends and Forecast v.17
The tool to calculate stock demand trends and make predictions for future demand statistically
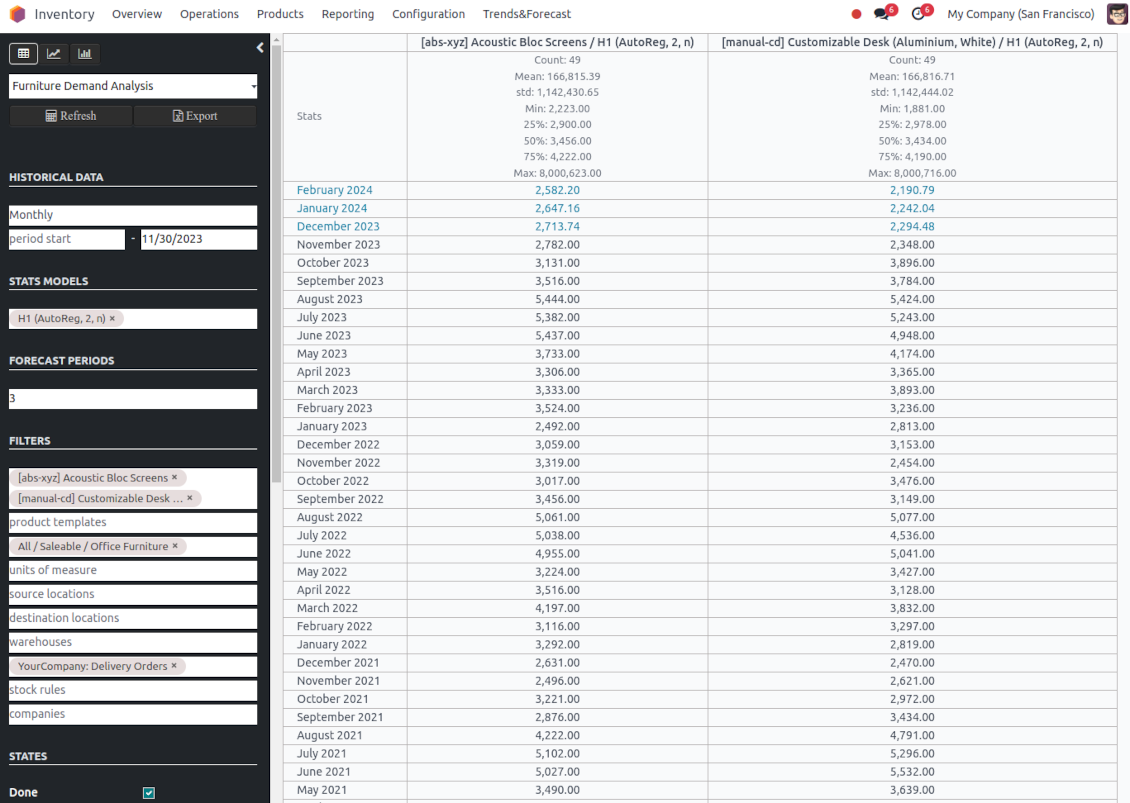
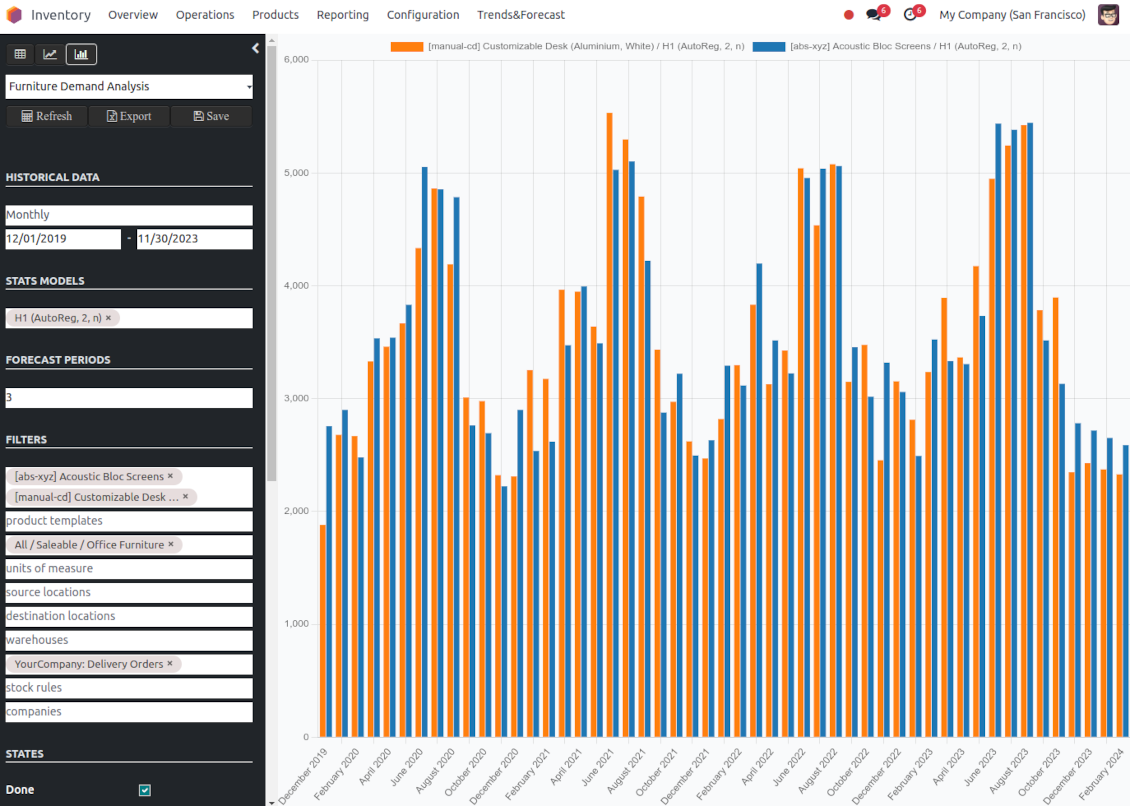
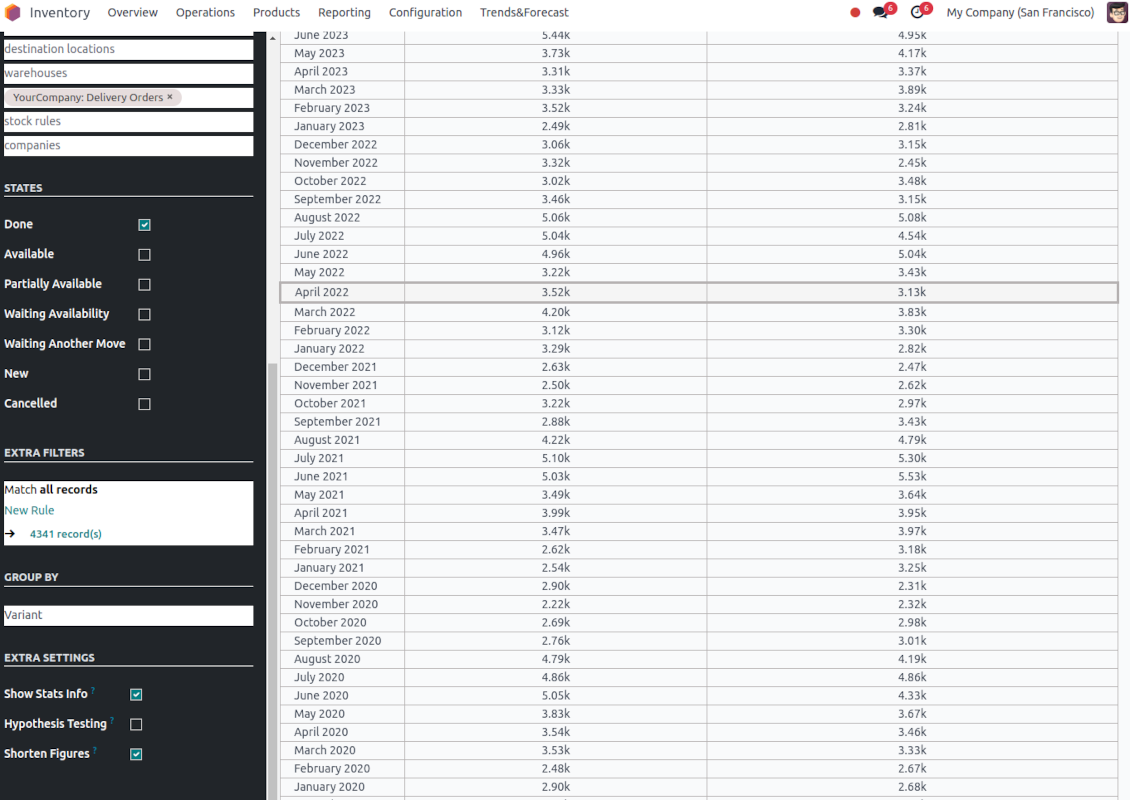
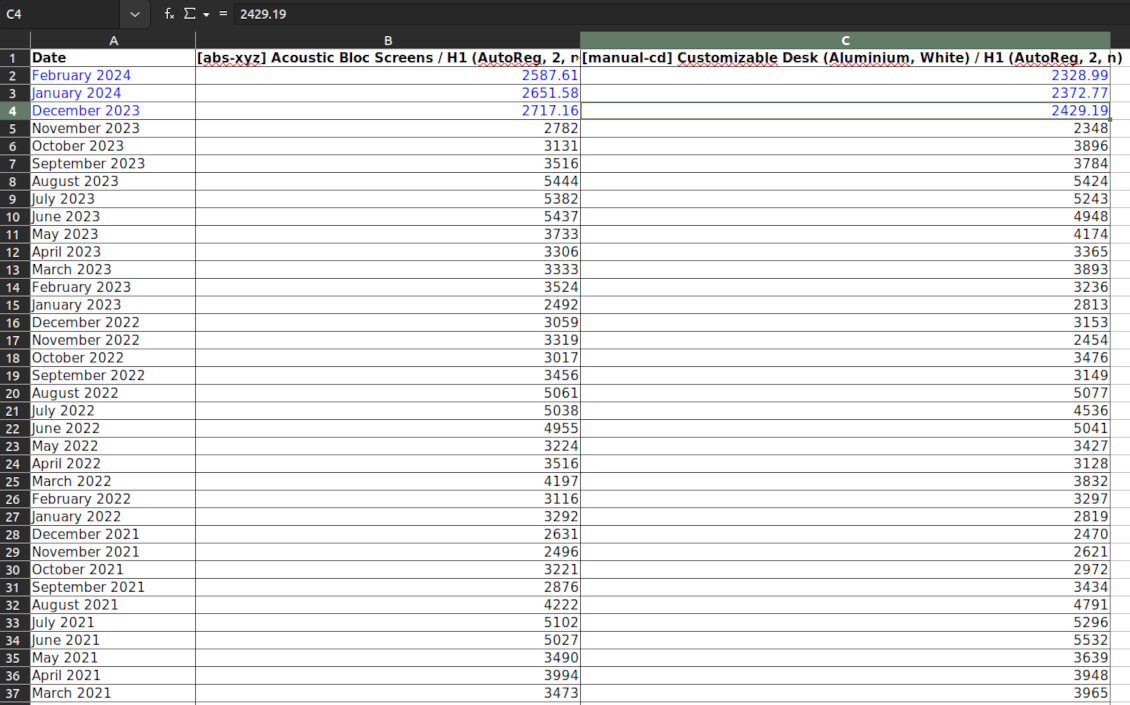
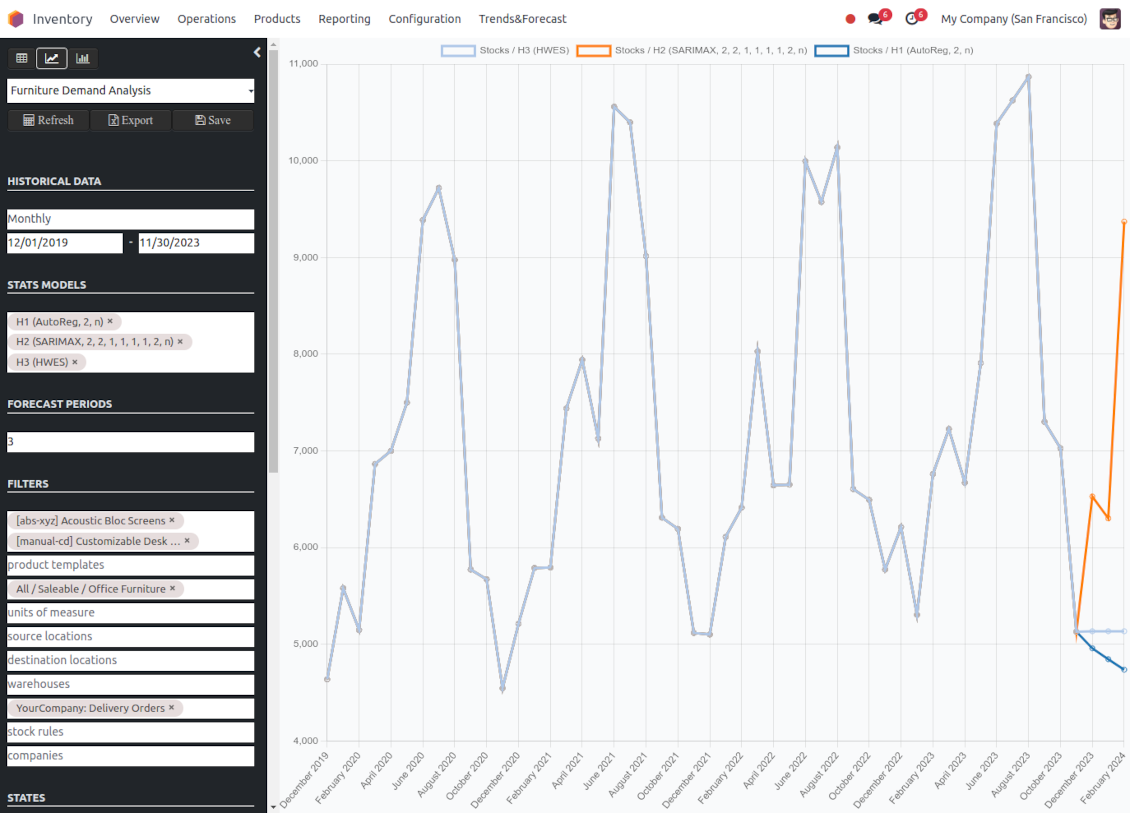
If you knew the stock demand trends of your warehouses, you would have a clue to decrease keeping costs and have a flawless supply chain. Regretfully, you can't know the future. However, you can predict it with a certain reliability. This is an Odoo tool for that goal. The app lets you construct stock demand by periods and forecast scientifically further demand based on the Python library statsmodels.
The scientific approach to forecasting
The app assumes applying statistical methods to calculate historical trends and make a forecast. Experiment with statistical models and parameters to achieve the most reliable prediction. Leverage the proven statsmodels methods
Innovative data analysis interface
The tool introduces a special interface to instantly calculate series. Flexibly switch between different reports and update settings in a few clicks. Control data in pivot, graph, or chart views. Export series as an Excel tabled
Focused analysis
Shrink considered stock operations flexibly or analyze global company inventory demand. Group data into various series
Topical data
Apply time frames for historical data and work with intervals that are of interest to your industry. Work with past and future periods.
Flexible report configuration
-
Introduce as many analytic reports as you need. Each report is based on Odoo's stock moves' data
-
Keep reports to re-use them, instantly switch between reports, or experiment with real-time changes without saving those
-
Show historical and forecast series as a table, line graph, or bar chart, or export data as an Excel table
-
Apply as many and as different statistical models as you want to check. Each stats model will peer its own data series and prediction if the latter is possible. See also the section "Statistical models"
-
Define the data periods under analysis by entering a start and end. Only inventory data within this interval will be included in the series
-
Split data series into years, quarters, months, weeks, and days depending on seasons assumed in your industry or business area
-
Select an unlimited number of periods to predict future periods or check hypotheses
-
Grant the right to forecast tools for any WMS user (the group Inventory > Stock Demand Forecast)
-
Filter stock data by product variants, product templates, product categories, units of measurement, source or destination locations, warehouses, operation/picking types, stock rules, and companies (for multi-company regimes). Introduce your own criteria based on Odoo's dynamic domain constructor, so shrink analysis by any stock move storable fields
-
Introduce a few data series simultaneously with grouping by a product variant, a unit of measurement, a source or destination location, a warehouse, a stock move state, an operation type, a stock rule, or a company. Take into that if the report assumes products with different units of measurement, the grouping will be possible only by the units or by variants
-
Hide/show general statistical measurement of series: count, mean, standard deviation, minimum, maximum, 25%, 50%, and 75% factors
-
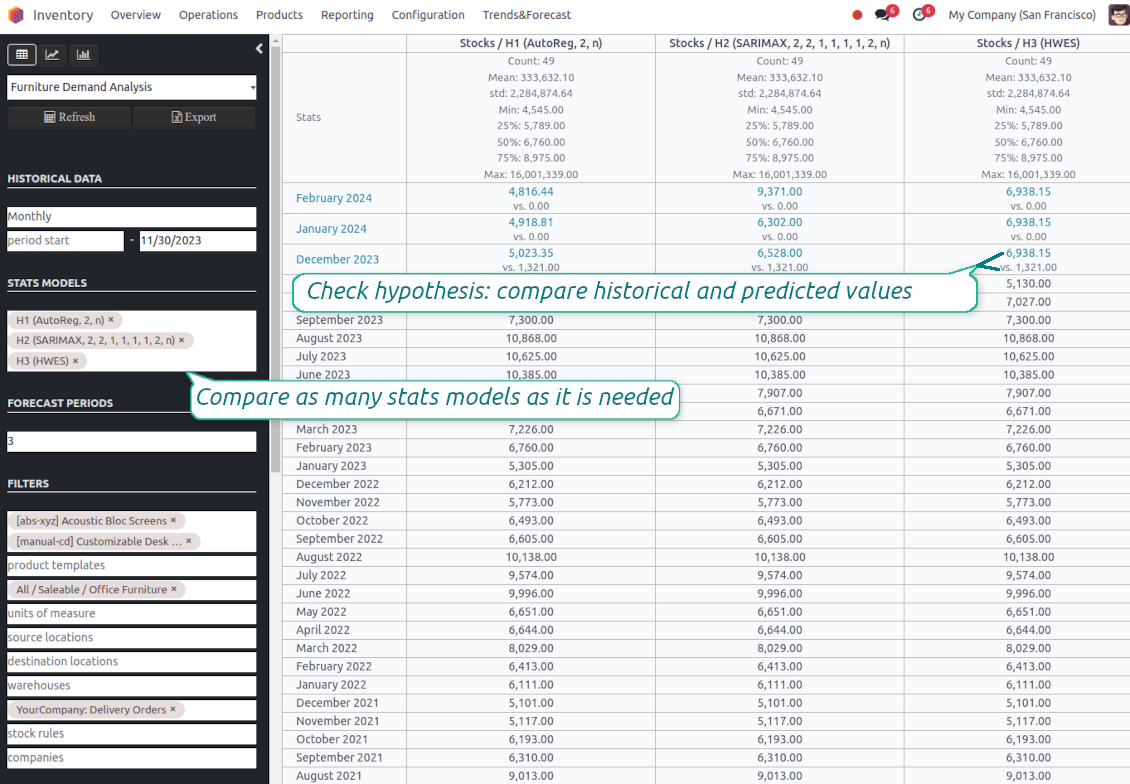
Optionally compare predicted values to real historical data if any. See also the section "Hypothesis Testing"
-
Make figures human readable (e.g. 192,217 as 200k) or show them precisely.
Statistical models
-
The tool allows calculating inventory demand trends based on predefined statistical models introduced by the Python package statsmodels
-
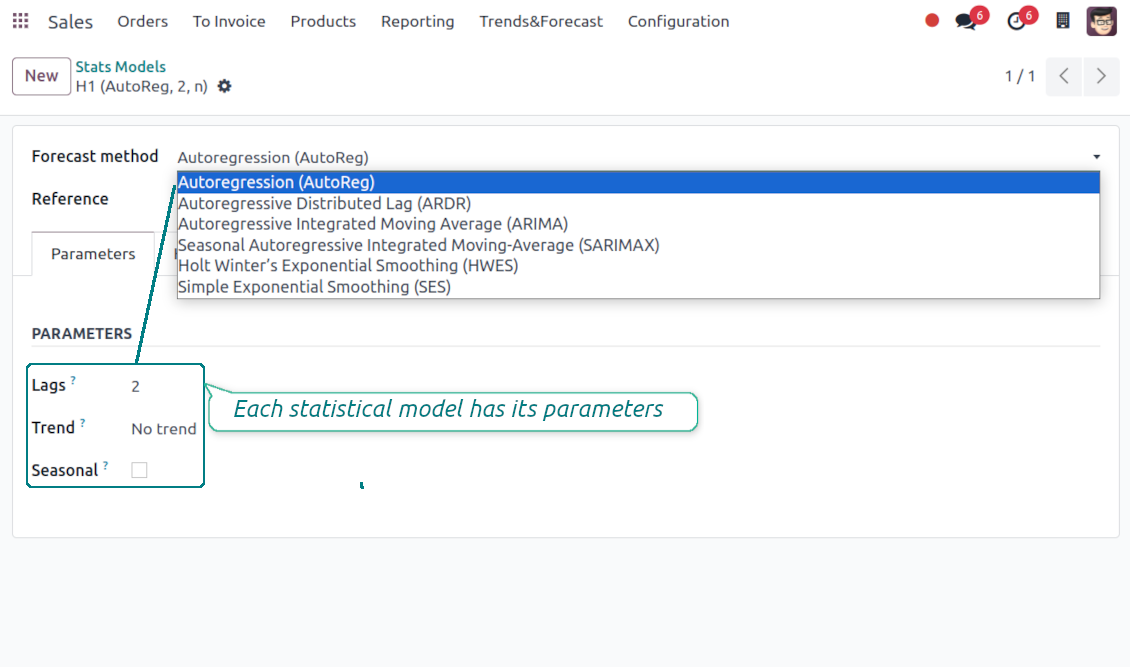
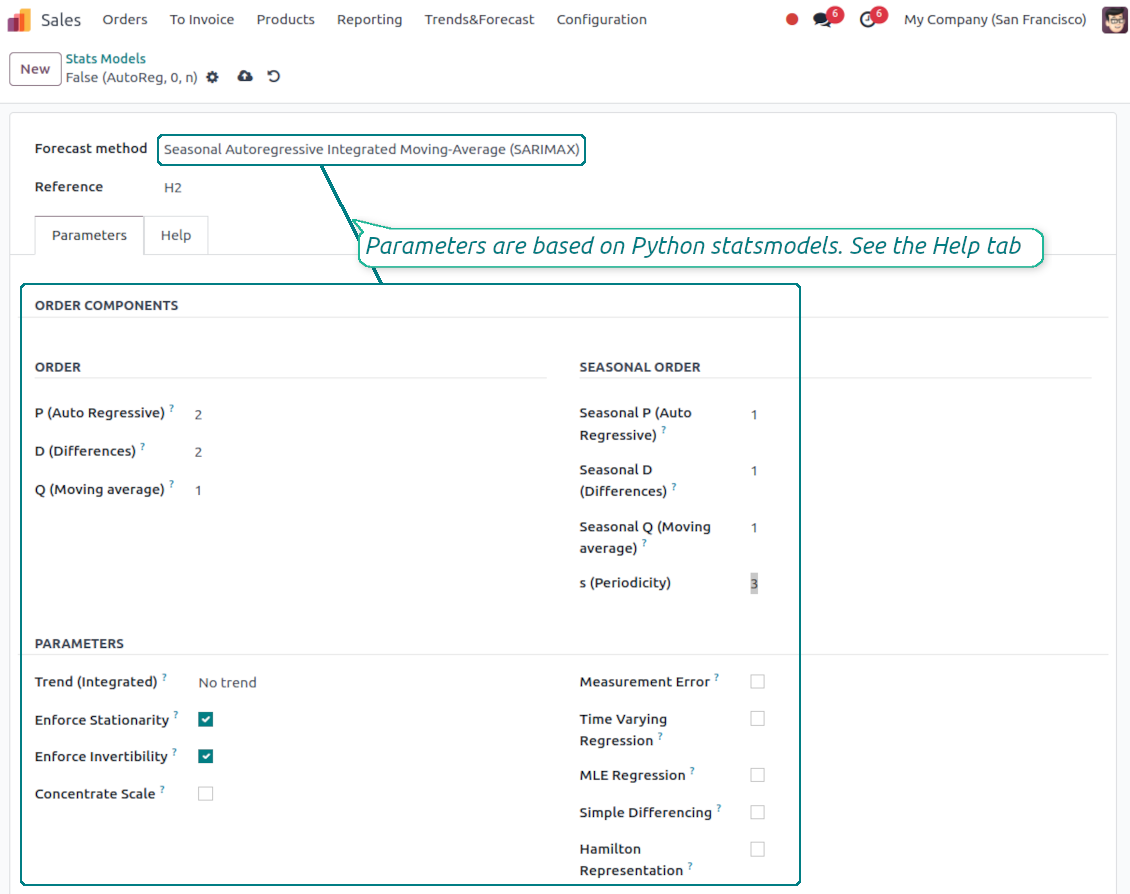
Methods have different complexity, and their own unique parameters, and might be suitable for a definite market or a specific business. The final choice of the model and related statistical parameters is only up to you. Nobody except you can better understand tendencies in your company inventory demand, and hence which methods and factors should be applied
-
Available statistical models are Autoregression (AutoReg), Autoregressive Distributed Lag (ARDR), Autoregressive Integrated Moving Average (ARIMA), Seasonal Autoregressive Integrated Moving-Average (SARIMAX), Holt Winter's Exponential Smoothing (HWES), Simple Exponential Smoothing (SES)
-
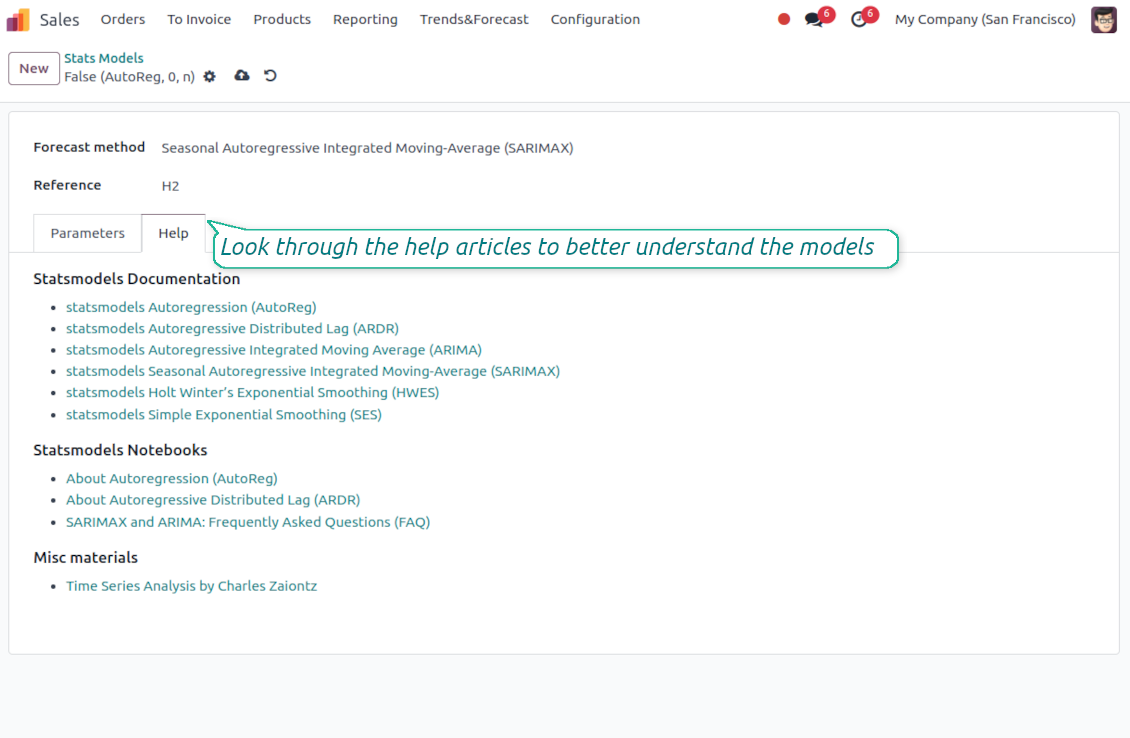
For deep details about what each stats model means and which parameters might be applied, look through the tab "Help" on the stats model form
-
Keep and use an unlimited number of stats models with various parameters. Check, compare, and update those flexibly through the forecast manager interface
-
Often models with specific parameters will not result in any prediction or the prediction will be unrealistic. This is normal, only a deep understating of trends and much experimenting might give a viable forecast for your specific case.
Hypothesis Testing
-
To get a proper prediction, it is usually needed to experiment a lot with statistical models and introduced parameters. To check the results, the app allows compare forecast data with real values
-
To check a certain assumption with historical values, you may make an analysis and prediction for some past periods, and turn on the setting "Hypothesis testing"
-
For example, you have stock moves from 2017 to 2022. Then, you can get report historical data for 2017-2021, and make the forecast for 12 months of 2022. In this way, you will get the prediction for the interval for which you already have actual values. By comparing forecast and actual values, you can decide whether a chosen model and factors are good enough
-
The app allows checking the hypotheses for a few stats models simultaneously. In this way, it is possible to reveal what is actually the most appropriate, or whether experimenting should be continued.
Usage requirements
-
To reveal trends, there should be enough historical stock moves data. It is senseless to make a forecast based on the last 5 days of operations since no trend cannot be retrieved. Take into account that data should be enough for the chosen filters and for each grouped series
-
There should be not only enough stock moves but also there should be some actual trends. Chaotic data will not result in reliable predictions. To use the app, you should understand which assumptions (e.g. seasonal changes) you check
-
To use the app, you either should have a clear understanding of how statistics works or a will to understand that. Regretfully, there is no way to make a "general" analysis, each specific case is unique and requires its own elaboration.
نصائح التكوين والتثبيت لـ Stock Demand Trends and Forecast Odoo v.17
Python dependencies
To guarantee the tool works correctly, a number of Python libraries are required: pandas, numpy, statsmodels, scipy, xlsxwriter. To install those packages execute the command:
pip3 install pandas numpy statsmodels scipy xlsxwriter
If you run Odoo on Python prior to or equal to version 3.7, please install the following versions of the packages pandas==1.3.5, statsmodels==0.13.1
Server memory limits
Running the statistical analysis and making the forecast is quite a resource-demanding operation. If users face the hanging interface, make sure that server memory limits and timeouts are enough. Otherwise, increase those settings.
الأسئلة الشائعة حول Stock Demand Trends and Forecast Odoo v.17
ما سياسة تحديث ادواتكم؟
وفق سياسات Odoo Apps Store الحالية:
- كل وحدة مشتراة للإصدار 12.0 وما قبله تمنح الوصول إلى كل الإصدارات حتى 12.0.
- بدءا من الإصدار 13.0 تُشترى كل نسخة من الوحدة على حدة.
- بغض النظر عن الإصدار، الشراء يعطي حق كل التحديثات والإصلاحات ضمن الإصدار الرئيسي.
فريق faOtools لا يتحكم بهذه السياسات. للأسئلة تواصلوا مباشرة مع ممثلي Odoo Apps Store.
كيف اثبّت التطبيق على Odoo.sh؟
أبسط طريقة هي مسار متجر Odoo المدمج:
1. افتح صفحة الوحدة واضغط Deploy on odoo.sh
2. ستُنقل إلى GitHub. سجّل الدخول ثم Create a new repo أو استخدم مستودعا قائما. يجب أن يكون المستودع خاصا. لا يُسمح بنشر التطبيقات بترخيص OPL-1. أنشئ مستودعا جديدا لمشروع Odoo.sh عند الحاجة
3. ثم في odoo.sh اضغط Deploy وأكّد ثم Continue. يبدأ التثبيت.
هذه الخطوات تثبّت التطبيق على فرع الإنتاج. لفروع أخرى أو للتحديث:
1. نزّل الشيفرة من متجر Odoo
2. اعمل commit للوحدة في مستودع GitHub. لا تُستثنى مجلدات/ملفات التطبيق في .gitignore. مستودعات odoo.sh قد تتجاهل مسارات مهمة (مثل /lib). ارفع كل مجلدات وملفات الوحدة
3. انشر الفرع المستهدف في مشروع odoo.sh أو انتظر البناء التلقائي إن كانت الإعدادات كذلك.
كيف اثبّت التطبيق على خادمي؟
2. أعد تشغيل خادم Odoo;
3. فعّل وضع المطوّر (الإعدادات التقنية);
4. حدّث قائمة التطبيقات (قائمة التطبيقات);
5. اعثر على التطبيق واضغط Activate/Install;
6. اتبع الإرشادات في صفحة التطبيق إن وُجدت.
للتطبيق إضافات أخرى. هل اشتريها لاحقا؟
نعم. يضيف Odoo التبعيات تلقائيا إلى السلة؛ استبعد الأدوات المشتراة سابقا حتى لا تدفع مرتين.
نشرت التطبيق على Odoo.sh وأرى تحذيرا/خطأ في الاختبارات
التحذير الأحمر/البرتقالي لا يؤثر على وظائف التطبيق. أحيانا لا تتجاوز وحداتنا الاختبارات التلقائية القياسية لأنها تفترض سلوكا يتعارض مع أهداف التطبيق. مثلا نغيّر حساب السعر بينما تقارن اختبارات Odoo السعر النهائي بالخوارزمية القياسية.
تحقق أولا من وظائف قاعدة البيانات المنشورة. هل كل شيء يعمل؟
إن ظننتم أن التحذير يؤثر على وظائف حقيقية، تواصلوا معنا وأرسلوا سجلات التثبيت كاملة وقائمة الوحدات المنشورة كاملة (الأساسية والطرف الثالث).
هل يمكنني شراء التطبيق منكم مباشرة؟
لا، نوزع الأدوات فقط عبر متجر تطبيقات Odoo الرسمي.
اريد خصما
للأسف ليست لدينا وسيلة تقنية لتقديم أسعار فردية.
هل يمكن تثبيت التطبيق على قاعدة Odoo Online (SaaS)؟
لا، لا يمكن استخدام تطبيقات الطرف الثالث على Odoo Online. خدمة Odoo SaaS تمنع ذلك.
للاداة تبعيات على تطبيقات أخرى. هل اشتريها؟
نعم، تحتاج الأداة إلى كل الوحدات المذكورة في التبعيات. السعر في صفحة التطبيق يشمل هذه التبعيات.
ما سعر الوحدة بالدولار الأمريكي؟ لماذا تغيّر؟
أسعار وحداتنا باليورو. يحوّل متجر Odoo الأسعار إلى عملات أخرى حسب سعره الداخلي. لذا قد يتغيّر السعر بالدولار الأمريكي عند تحديث سعر الصرف.
تتم صياغة نصوص التطبيق والموقع الإلكتروني باللغات غير الإنجليزية بمساعدة الذكاء الاصطناعي وبما يتوافق مع ترجمات Odoo الرسمية. إذا لاحظت خطأ، أرسل تذكرة تصحيح الترجمة وسنقوم بتصحيحه.
قواعد بيانات Odoo التجريبية (معاينات)
قد نوفر لهذا التطبيق قاعدة بيانات تجريبية مخصصة مجانية.
لا تحتاج إلى رقم هاتف أو بطاقة ائتمان للاتصال بنا. يجب عليك فقط اجتياز عملية تسجيل قصيرة عبر البريد الإلكتروني, والتي لا تستغرق أكثر من 30 ثانية.
بناءً على طلبك، نُعِدّ قاعدة بيانات معاينة خاصة بك، يمكنك خلالها إجراء أي اختبارات والتحقق من افتراضاتك لمدة أسبوعين تقريبًا.
الإبلاغ عن الأخطاء
إذا واجهت أخطاء أو سلوكًا غير متسق, فلا تتردد في الاتصال بنا. نحن نضمن تقديم الإصلاحات خلال 60 يومًا من الشراء ونهتم بشدة بتحسين أدواتنا حتى بعد هذه الفترة.
لا تحتاج إلى رقم هاتف أو بطاقة ائتمان للاتصال بنا. يجب عليك فقط اجتياز عملية تسجيل قصيرة عبر البريد الإلكتروني, والتي لا تستغرق أكثر من 30 ثانية.
يرجى تضمين أكبر قدر ممكن من التفاصيل في طلبك: لقطات الشاشة وسجلات خادم Odoo ووصف كامل لكيفية إعادة إنتاج المشكلة وما الى ذلك. عادة ما يستغرق إعداد خطة عمل للمشكلة بضعة أيام عمل (اذا تأكد وجود خطا) او تزويدك بارشادات حول ما ينبغي فعله (في الحالات الأخرى).
طلبات الميزات العامة وأفكار الوحدات (تطوير مجاني)
لدينا دوافع قوية لتحسين أدواتنا وسنكون ممتنين لأي تعليقات. إذا كانت متطلباتك ذات استخدام عام ويمكن تنفيذها بكفاءة, فسيقوم الفريق بإدراج تلك المتطلبات في قائمة المهام الخاصة بنا.
تتم معالجة قائمة المهام هذه بانتظام ولا يتم فرض رسوم إضافية. على الرغم من أننا لا نستطيع أن نعد بالمواعيد النهائية والتصميم النهائي, إلا أنها قد تكون طريقة جيدة للحصول على الميزات المطلوبة دون استثمارات ومخاطر.
لا تحتاج إلى رقم هاتف أو بطاقة ائتمان للاتصال بنا. يجب عليك فقط اجتياز عملية تسجيل قصيرة عبر البريد الإلكتروني, والتي لا تستغرق أكثر من 30 ثانية.

The tool to flexibly structure Odoo attachments in folders and synchronize directories with cloud clients: Google Drive, OneDrive/SharePoint, Nextcloud/ownCloud, Dropbox, Amazon S3, Box, and NAS. DMS. File Manager. Document management system
398€

The tool to build a deep and structured knowledge base for internal and external use. Knowledge System. KMS. Wiki-like revisions.
398€
The tool to automatically synchronize Odoo attachments with OneDrive files in both ways
487€
The tool to set up KPI targets and control their fulfillment by periods. KPI dashboards. Dashboard designer. KPI charts

The tool for time-based service management from booking appointments to sales and reviews
398€
The tool to automatically synchronize Odoo attachments with Google Drive files in both ways
487€
The tool to configure variant prices based on attributes coefficients and surpluses
98€