Stock Demand Trends and Forecast v.17
The tool to calculate stock demand trends and make predictions for future demand statistically
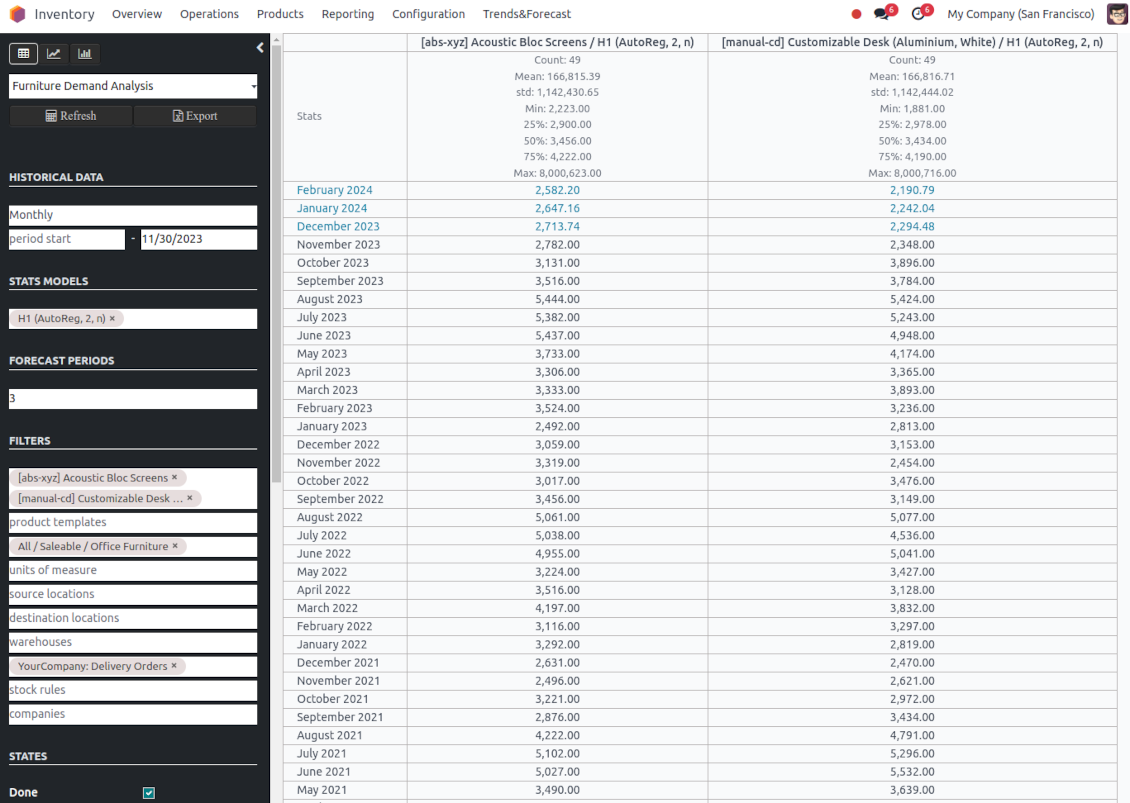
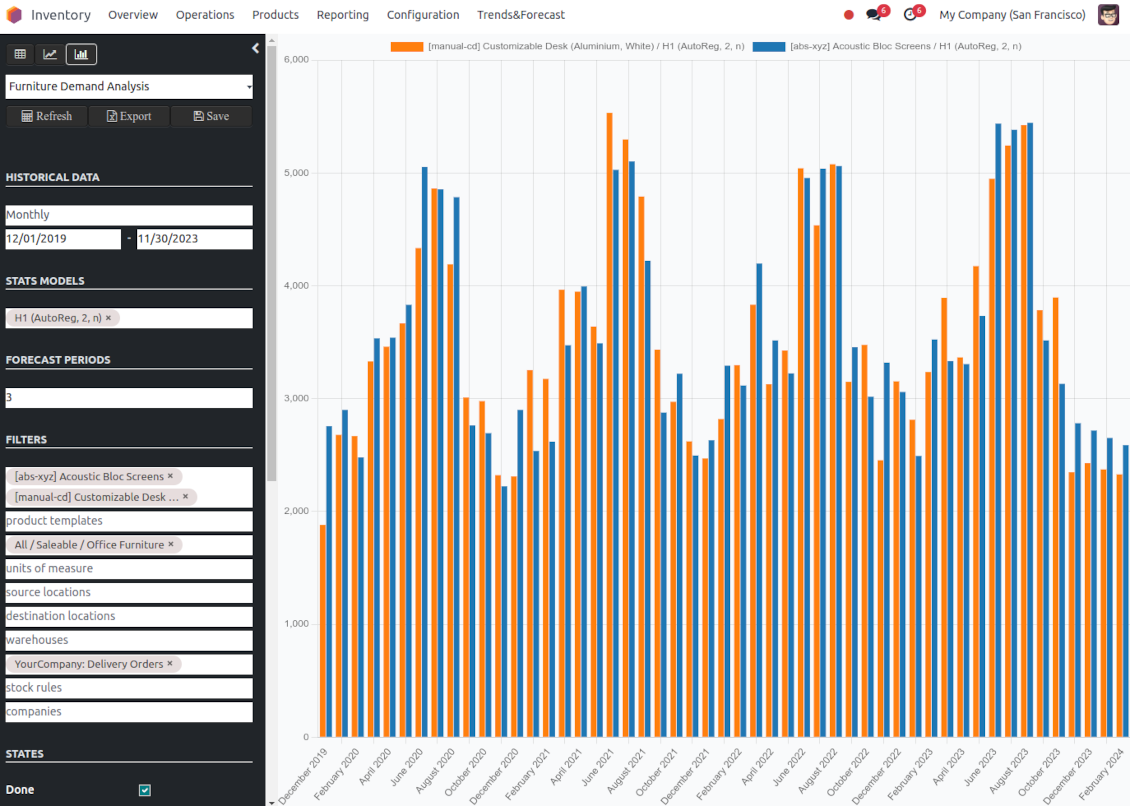
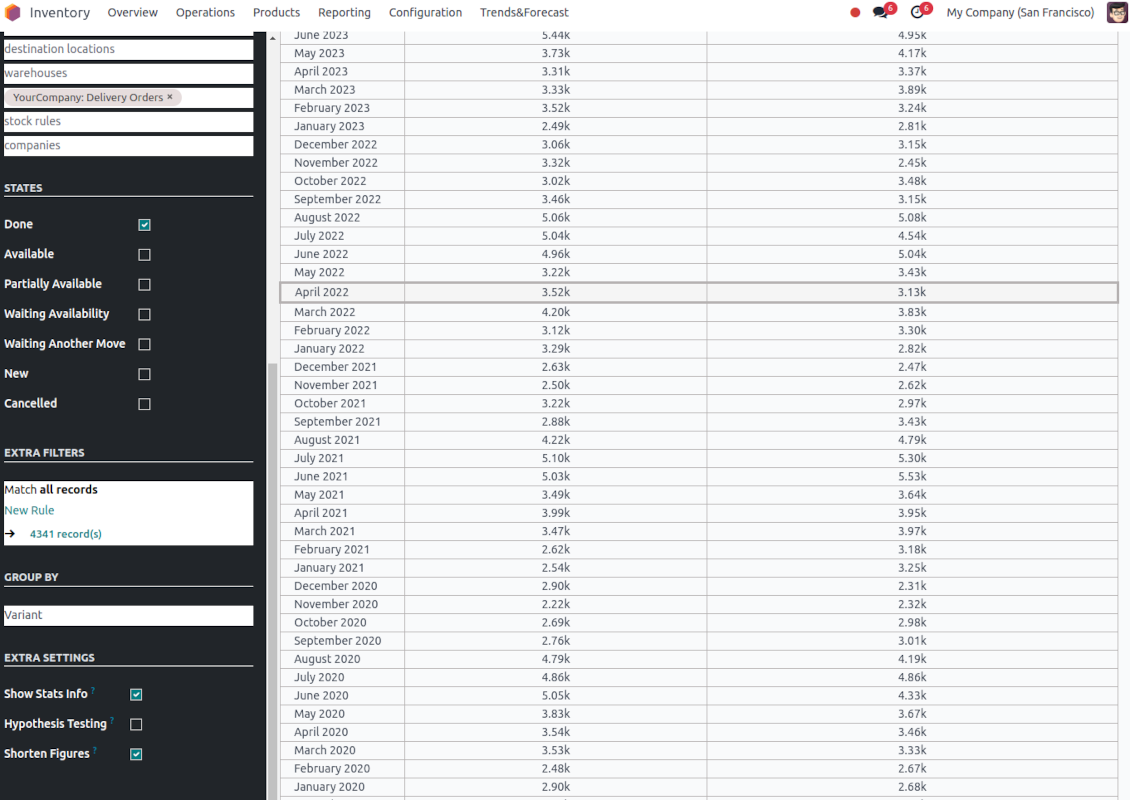
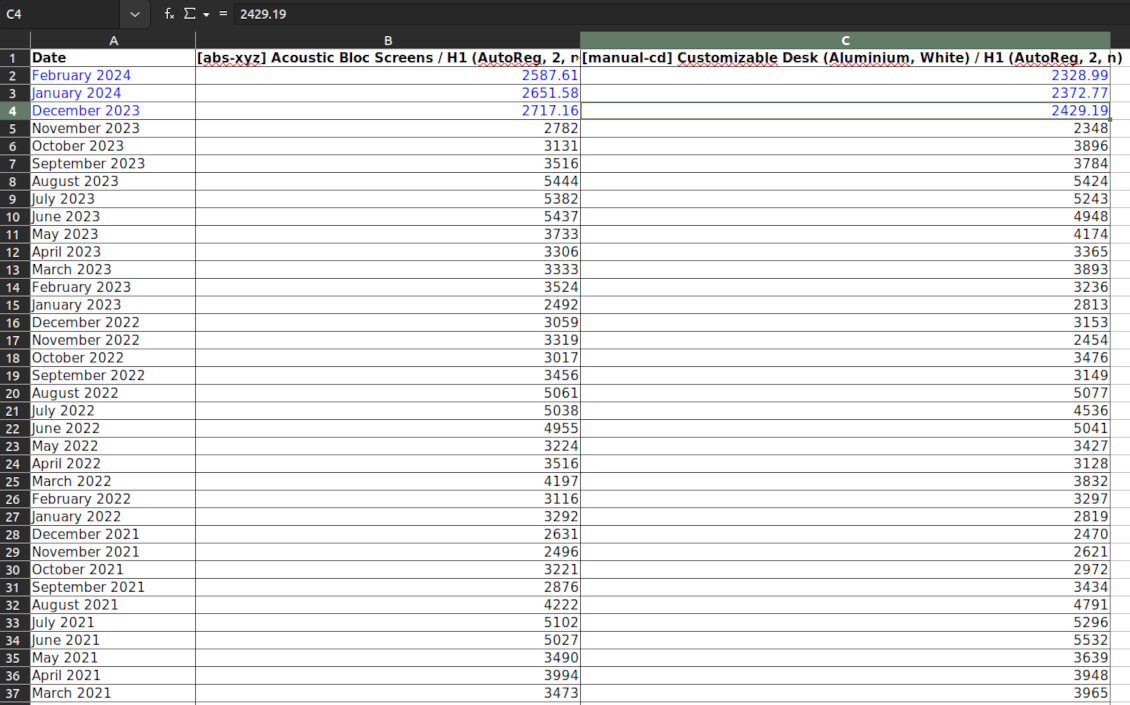
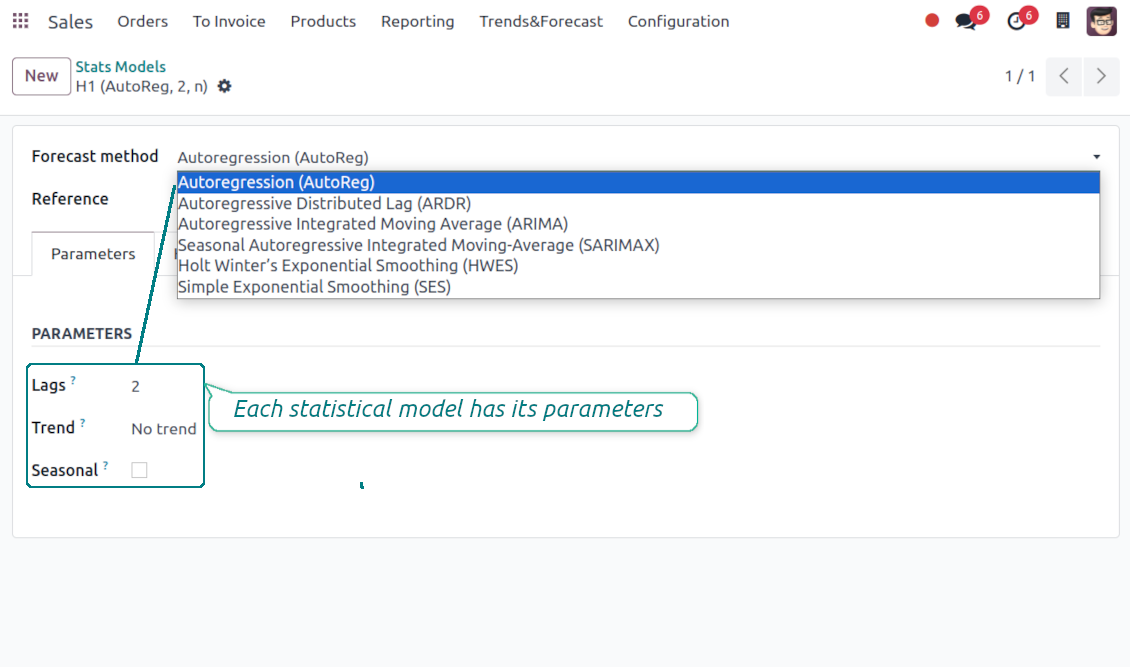
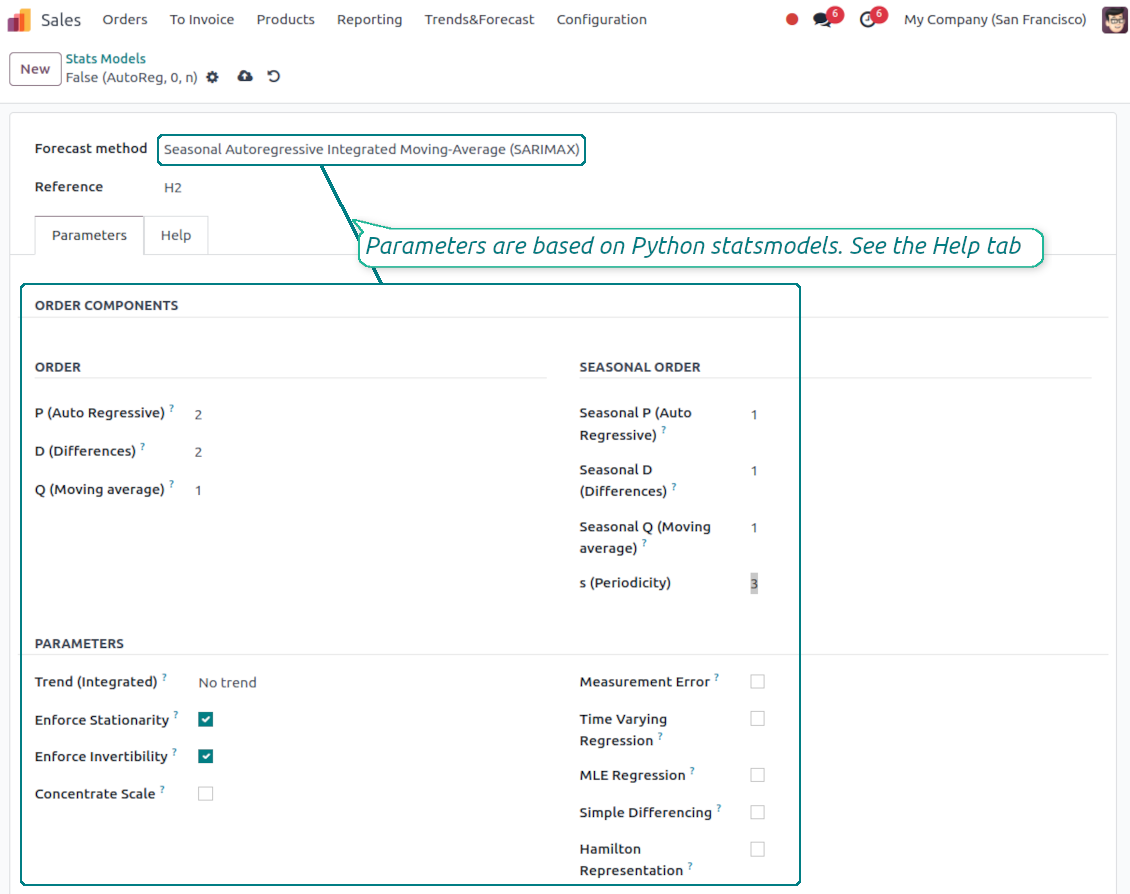
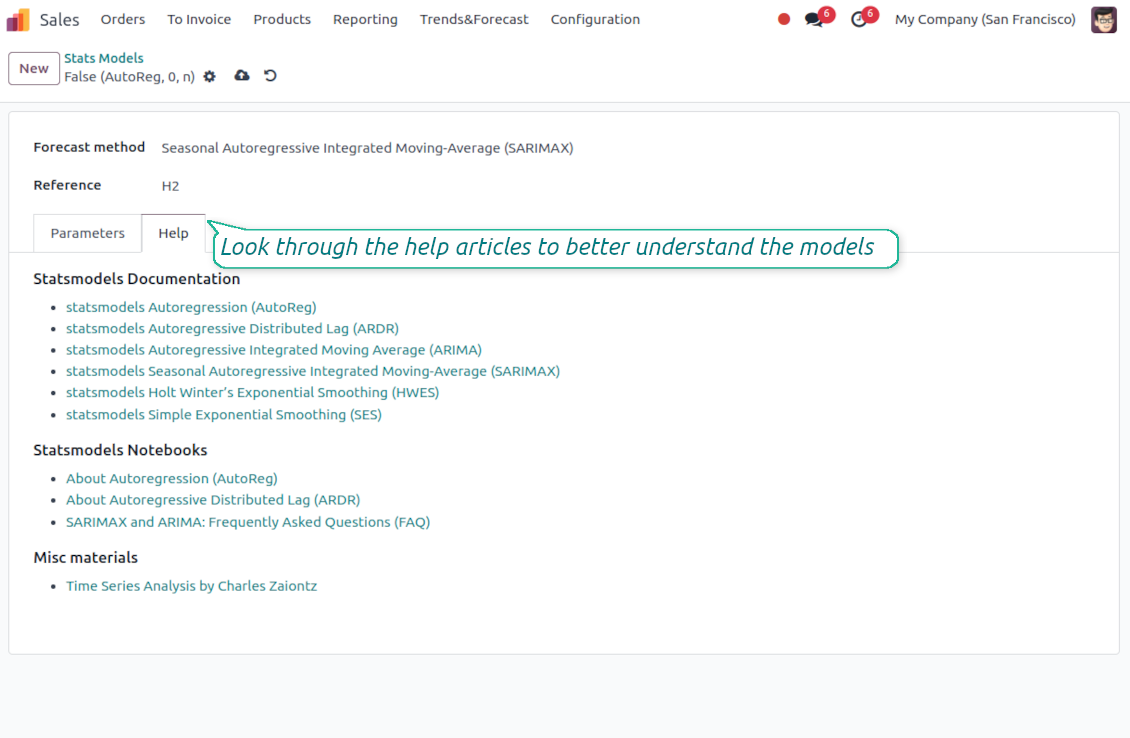
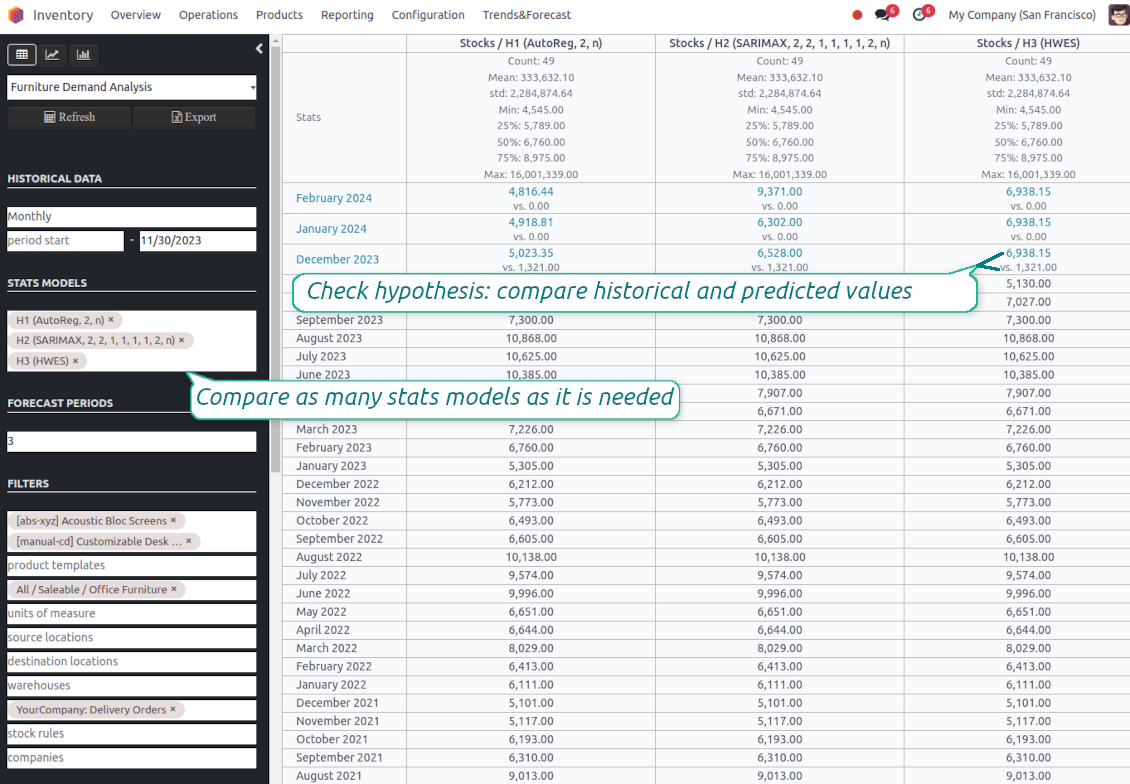
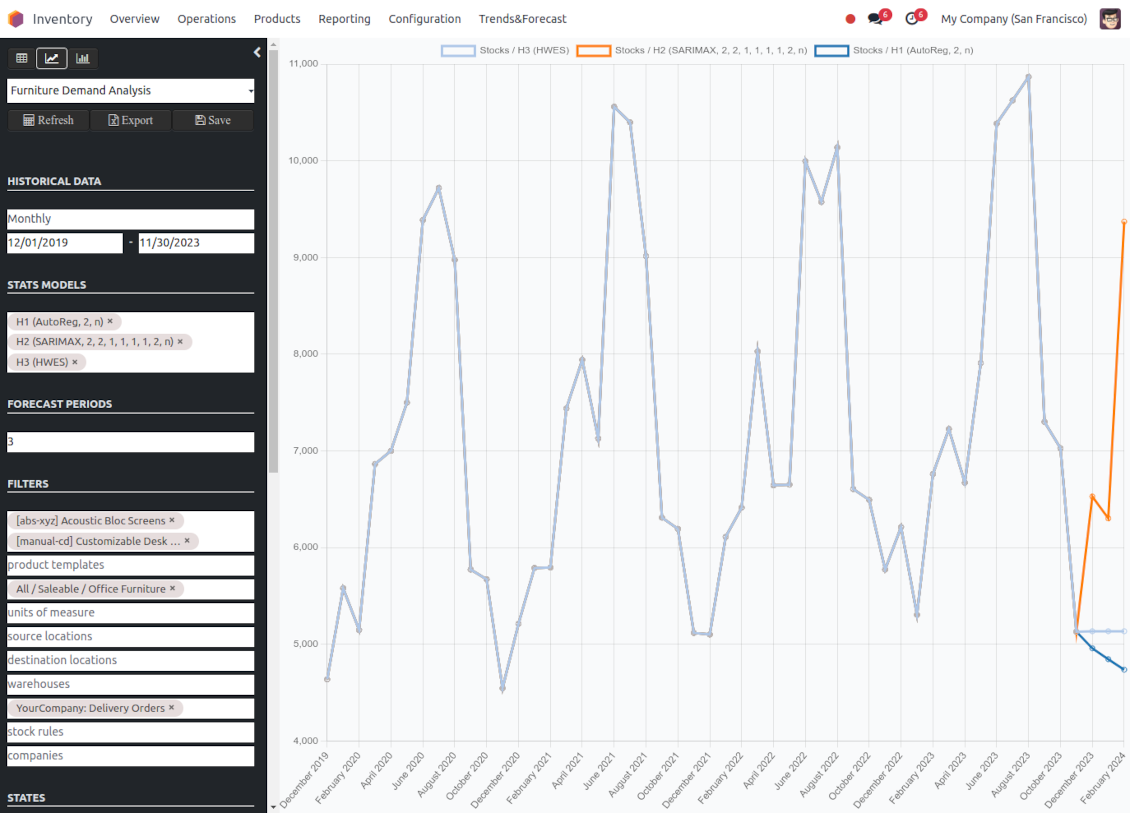
If you knew the stock demand trends of your warehouses, you would have a clue to decrease keeping costs and have a flawless supply chain. Regretfully, you can't know the future. However, you can predict it with a certain reliability. This is an Odoo tool for that goal. The app lets you construct stock demand by periods and forecast scientifically further demand based on the Python library statsmodels.
The scientific approach to forecasting
The app assumes applying statistical methods to calculate historical trends and make a forecast. Experiment with statistical models and parameters to achieve the most reliable prediction. Leverage the proven statsmodels methods
Innovative data analysis interface
The tool introduces a special interface to instantly calculate series. Flexibly switch between different reports and update settings in a few clicks. Control data in pivot, graph, or chart views. Export series as an Excel tabled
Focused analysis
Shrink considered stock operations flexibly or analyze global company inventory demand. Group data into various series
Topical data
Apply time frames for historical data and work with intervals that are of interest to your industry. Work with past and future periods.
Flexible report configuration
-
Introduce as many analytic reports as you need. Each report is based on Odoo's stock moves' data
-
Keep reports to re-use them, instantly switch between reports, or experiment with real-time changes without saving those
-
Show historical and forecast series as a table, line graph, or bar chart, or export data as an Excel table
-
Apply as many and as different statistical models as you want to check. Each stats model will peer its own data series and prediction if the latter is possible. See also the section "Statistical models"
-
Define the data periods under analysis by entering a start and end. Only inventory data within this interval will be included in the series
-
Split data series into years, quarters, months, weeks, and days depending on seasons assumed in your industry or business area
-
Select an unlimited number of periods to predict future periods or check hypotheses
-
Grant the right to forecast tools for any WMS user (the group Inventory > Stock Demand Forecast)
-
Filter stock data by product variants, product templates, product categories, units of measurement, source or destination locations, warehouses, operation/picking types, stock rules, and companies (for multi-company regimes). Introduce your own criteria based on Odoo's dynamic domain constructor, so shrink analysis by any stock move storable fields
-
Introduce a few data series simultaneously with grouping by a product variant, a unit of measurement, a source or destination location, a warehouse, a stock move state, an operation type, a stock rule, or a company. Take into that if the report assumes products with different units of measurement, the grouping will be possible only by the units or by variants
-
Hide/show general statistical measurement of series: count, mean, standard deviation, minimum, maximum, 25%, 50%, and 75% factors
-
Optionally compare predicted values to real historical data if any. See also the section "Hypothesis Testing"
-
Make figures human readable (e.g. 192,217 as 200k) or show them precisely.
Statistical models
-
The tool allows calculating inventory demand trends based on predefined statistical models introduced by the Python package statsmodels
-
Methods have different complexity, and their own unique parameters, and might be suitable for a definite market or a specific business. The final choice of the model and related statistical parameters is only up to you. Nobody except you can better understand tendencies in your company inventory demand, and hence which methods and factors should be applied
-
Available statistical models are Autoregression (AutoReg), Autoregressive Distributed Lag (ARDR), Autoregressive Integrated Moving Average (ARIMA), Seasonal Autoregressive Integrated Moving-Average (SARIMAX), Holt Winter's Exponential Smoothing (HWES), Simple Exponential Smoothing (SES)
-
For deep details about what each stats model means and which parameters might be applied, look through the tab "Help" on the stats model form
-
Keep and use an unlimited number of stats models with various parameters. Check, compare, and update those flexibly through the forecast manager interface
-
Often models with specific parameters will not result in any prediction or the prediction will be unrealistic. This is normal, only a deep understating of trends and much experimenting might give a viable forecast for your specific case.
Hypothesis Testing
-
To get a proper prediction, it is usually needed to experiment a lot with statistical models and introduced parameters. To check the results, the app allows compare forecast data with real values
-
To check a certain assumption with historical values, you may make an analysis and prediction for some past periods, and turn on the setting "Hypothesis testing"
-
For example, you have stock moves from 2017 to 2022. Then, you can get report historical data for 2017-2021, and make the forecast for 12 months of 2022. In this way, you will get the prediction for the interval for which you already have actual values. By comparing forecast and actual values, you can decide whether a chosen model and factors are good enough
-
The app allows checking the hypotheses for a few stats models simultaneously. In this way, it is possible to reveal what is actually the most appropriate, or whether experimenting should be continued.
Usage requirements
-
To reveal trends, there should be enough historical stock moves data. It is senseless to make a forecast based on the last 5 days of operations since no trend cannot be retrieved. Take into account that data should be enough for the chosen filters and for each grouped series
-
There should be not only enough stock moves but also there should be some actual trends. Chaotic data will not result in reliable predictions. To use the app, you should understand which assumptions (e.g. seasonal changes) you check
-
To use the app, you either should have a clear understanding of how statistics works or a will to understand that. Regretfully, there is no way to make a "general" analysis, each specific case is unique and requires its own elaboration.
Konfigurasjons- og installasjonstips for Stock Demand Trends and Forecast Odoo v.17
Python dependencies
To guarantee the tool works correctly, a number of Python libraries are required: pandas, numpy, statsmodels, scipy, xlsxwriter. To install those packages execute the command:
pip3 install pandas numpy statsmodels scipy xlsxwriter
If you run Odoo on Python prior to or equal to version 3.7, please install the following versions of the packages pandas==1.3.5, statsmodels==0.13.1
Server memory limits
Running the statistical analysis and making the forecast is quite a resource-demanding operation. If users face the hanging interface, make sure that server memory limits and timeouts are enough. Otherwise, increase those settings.
Ofte stilte spørsmål om Stock Demand Trends and Forecast Odoo v.17
Hva er oppdateringsreglene for verktoyene deres?
Ifolge gjeldende retningslinjer for Odoo Apps Store:
- Hver modul kjopt for versjon 12.0 eller tidligere gir tilgang til alle versjoner opp til 12.0.
- Fra versjon 13.0 ma hver modulversjon kjopes separat.
- Uavhengig av versjon gir kjop rett til alle oppdateringer og feilrettinger innen en hovedversjon.
faOtools-teamet styrer ikke disse retningslinjene. Ved sporsmal, kontakt Odoo Apps Store-representantene direkte.
Hvordan installerer jeg appen pa Odoo.sh?
Den mest direkte fremgangsmaten er den innebygde arbeidsflyten i Odoo-butikken:
1. Åpne modulens side og klikk pa Deploy on odoo.sh
2. Du blir omdirigert til GitHub. Logg inn og klikk Create a new repo eller bruk et eksisterende. Repet ma vaere privat. Apper under OPL-1 far ikke publiseres. Opprett et nytt repo for Odoo.sh-prosjektet om nodvendig
3. Ga deretter til odoo.sh, klikk Deploy, bekreft og klikk Continue. Installasjonen starter.
Disse trinnene installerer appen pa production-grenen. For andre grener eller oppdatering:
1. Last ned kildekoden fra Odoo-butikken
2. Commit modulen til GitHub-repot. Ingen app-mapper/filer ma sta i .gitignore. Repoer opprettet av odoo.sh kan ignorere viktige stier (f.eks. /lib). Last opp alle modulmapper og -filer
3. Deploy malgrenen i odoo.sh-prosjektet, eller vent pa automatisk bygg hvis innstillingene tilsier det.
Hvordan installerer jeg appen pa min egen server?
2. Start Odoo-serveren pa nytt;
3. Sla pa utviklermodus (tekniske innstillinger);
4. Oppdater applisten (Apper-menyen);
5. Finn appen og trykk pa Activate/Install;
6. Folg retningslinjene pa appsiden hvis de finnes.
Appen har ekstra tillegg. Kan jeg kjope dem senere?
Ja. Odoo legger automatisk alle avhengigheter i handlekurven: utelat allerede kjopte verktoy for a unngå dobbel betaling.
Jeg deployet appen pa Odoo.sh og ser advarsel/feil i testene
En rod/oransje advarsel pavirker ikke appens funksjoner. Noen ganger består ikke modulene vare de vanlige automatiske testene, fordi de forventer atferd som er i konflikt med appens mal. Vi endrer for eksempel prisberegningen, mens Odoo-testene sammenligner sluttprisen med standardalgoritmen.
Sjekk forst funksjonene i den deployede databasen. Fungerer alt?
Hvis du likevel tror at advarselen pavirker reelle funksjoner, kontakt oss og send de fulle installasjonsloggene og den fulle listen over deployede moduler (kjerne og tredjepart).
Kan jeg kjope appen direkte fra dere?
Nei, vi distribuerer verktoyene bare via den offisielle Odoo-appbutikken.
Jeg onsker rabatt
Dessverre har vi ikke teknisk mulighet til a gi individuelle priser.
Kan jeg installere appen pa Odoo Online (SaaS)-databasen min?
Nei, tredjepartsapper kan ikke brukes pa Odoo Online. Odoo SaaS blokkerer den muligheten.
Verktoyet avhenger av andre apper. Ma jeg kjope dem?
Ja, verktoyet trenger alle modulene merket som avhengigheter. Prisen pa appsiden inkluderer allerede disse avhengighetene.
Hva koster modulen i amerikanske dollar? Hvorfor endret den seg?
Prisen pa modulene vare er satt i euro. Odoo-butikken konverterer til andre valutaer etter intern vekslingskurs. Derfor kan prisen i amerikanske dollar endre seg nar kursen oppdateres.
App- og nettstedstekster på andre språk enn engelsk er AI-assisterte og tilpasset offisielle Odoo-oversettelser. Hvis du oppdager en feil, send en sak om oversettelseskorrekthet så fikser vi det.
Odoo-demodatabaser (livedemoer)
For denne appen kan vi tilby en gratis personlig demodatabase.
Du trenger verken telefonnummer eller kredittkort for å kontakte oss. Det holder med en kort e-postregistrering som tar under 30 sekunder.
På forespørsel forbereder vi en individuell livedemo-database der du kan teste og sjekke antakelser i omtrent to uker.
Feilrapportering
Hvis du møter feil eller inkonsekvent oppførsel, kontakt oss. Vi garanterer rettelser innen 60 dager etter kjøp og forbedrer verktøyene også etter det.
Du trenger verken telefonnummer eller kredittkort for å kontakte oss. Det holder med en kort e-postregistrering som tar under 30 sekunder.
Ta med så mange detaljer som mulig: skjermbilder, Odoo-serverlogger og en full beskrivelse av hvordan problemet gjenskapes. Det tar vanligvis noen virkedager å lage en arbeidsplan (hvis feilen bekreftes) eller retningslinjer (ellers).
Offentlige funksjonsønsker og modulidéer (gratis utvikling)
Vi er sterkt motiverte til å forbedre verktøyene og takknemlige for all tilbakemelding. Hvis kravene er til offentlig nytte og kan implementeres effektivt, tar teamet dem med på oppgavelisten.
En slik gjøremålsliste behandles jevnlig og innebærer ingen ekstraavgifter. Selv om vi ikke kan love frister og endelig design, kan det være en god måte å få ønskede funksjoner uten investeringer og risiko.
Du trenger verken telefonnummer eller kredittkort for å kontakte oss. Det holder med en kort e-postregistrering som tar under 30 sekunder.

The tool to flexibly structure Odoo attachments in folders and synchronize directories with cloud clients: Google Drive, OneDrive/SharePoint, Nextcloud/ownCloud, Dropbox, Amazon S3, Box, and NAS. DMS. File Manager. Document management system
398€

The tool to build a deep and structured knowledge base for internal and external use. Knowledge System. KMS. Wiki-like revisions.
398€
The tool to automatically synchronize Odoo attachments with OneDrive files in both ways
487€
The tool to set up KPI targets and control their fulfillment by periods. KPI dashboards. Dashboard designer. KPI charts

The tool for time-based service management from booking appointments to sales and reviews
398€
The tool to automatically synchronize Odoo attachments with Google Drive files in both ways
487€
The tool to configure variant prices based on attributes coefficients and surpluses
98€