If future sales are a black box for you, you might hardly make profitable decisions right now. How many items to purchase? Which products require aggressive advertising? Where are the best markets for us for the next year? Luckily, statistics might help if you have enough historical data. This Odoo tool lets you generate sales by periods and apply statistical methods to scientifically forecast further periods.
The scientific approach to forecasting
The app assumes applying statistical methods to calculate historical sales trends and make a forecast. Experiment with statistical models and parameters to achieve the most reliable prediction. Leverage the proven statsmodels methods
Innovative data analysis interface
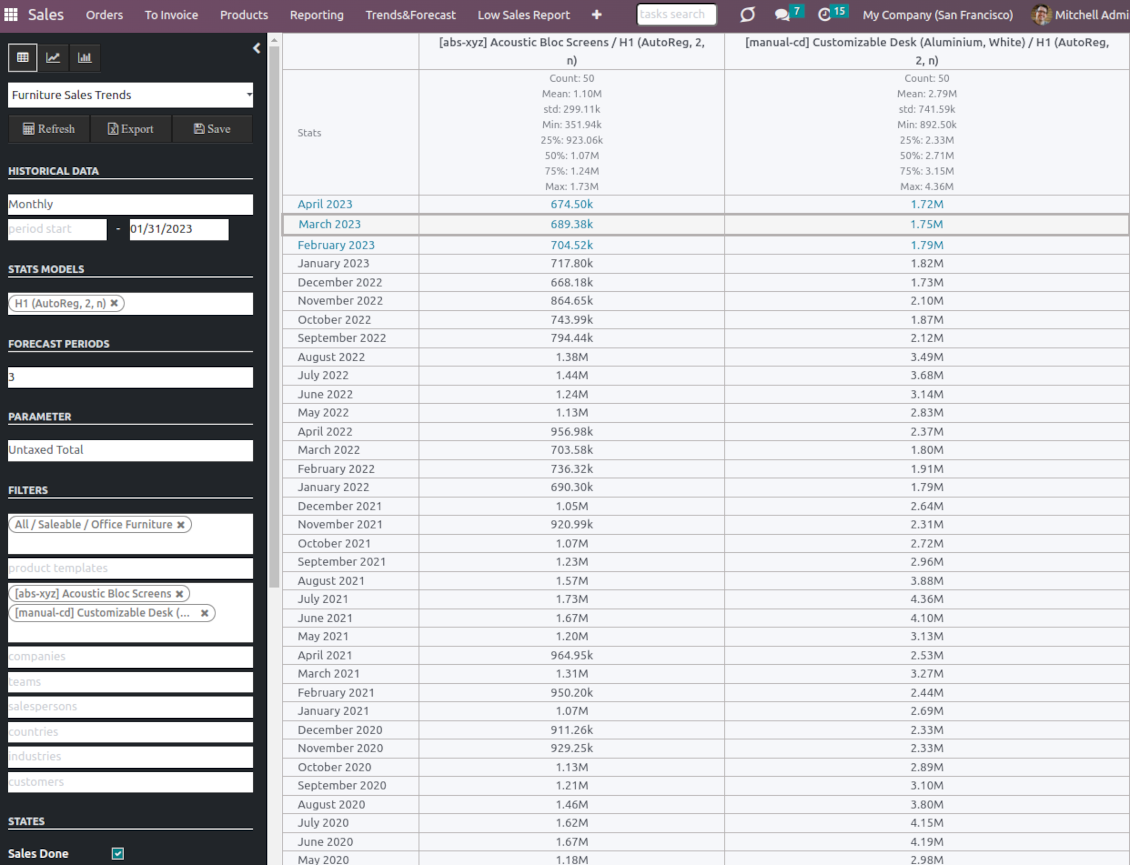
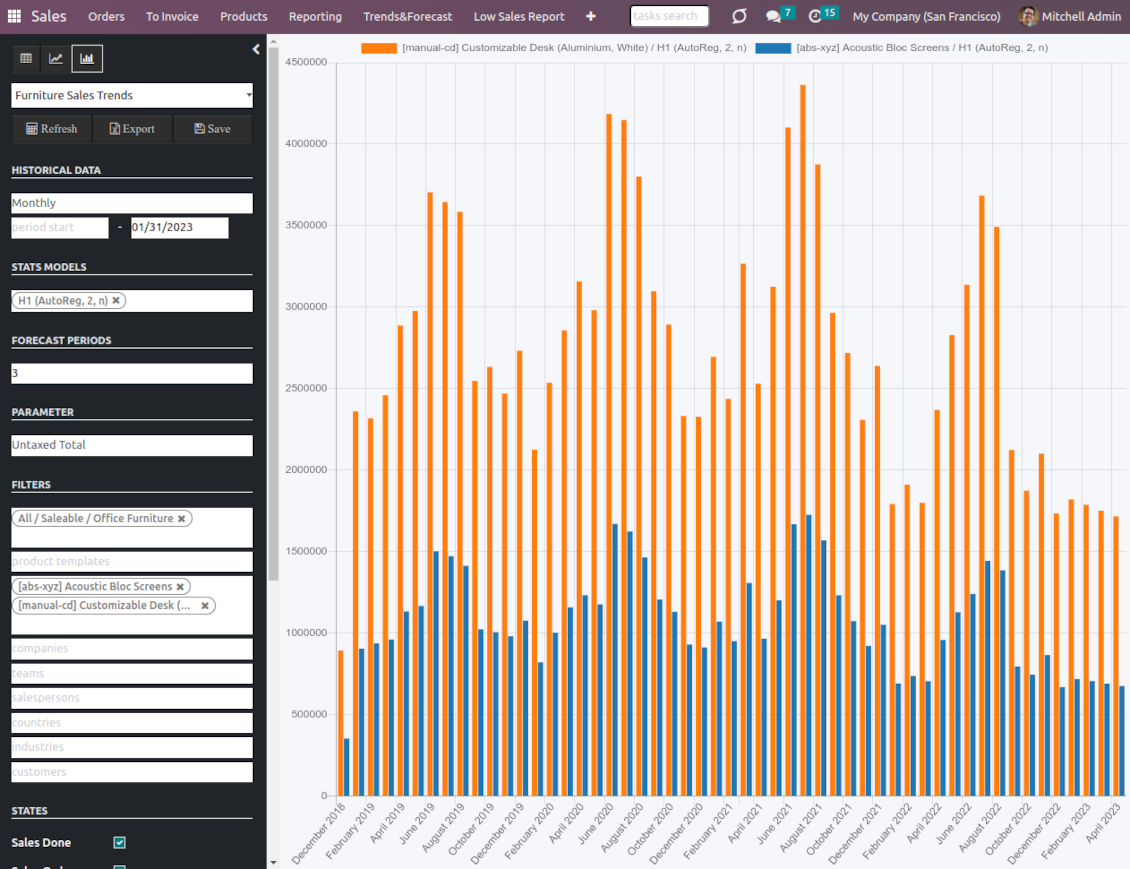
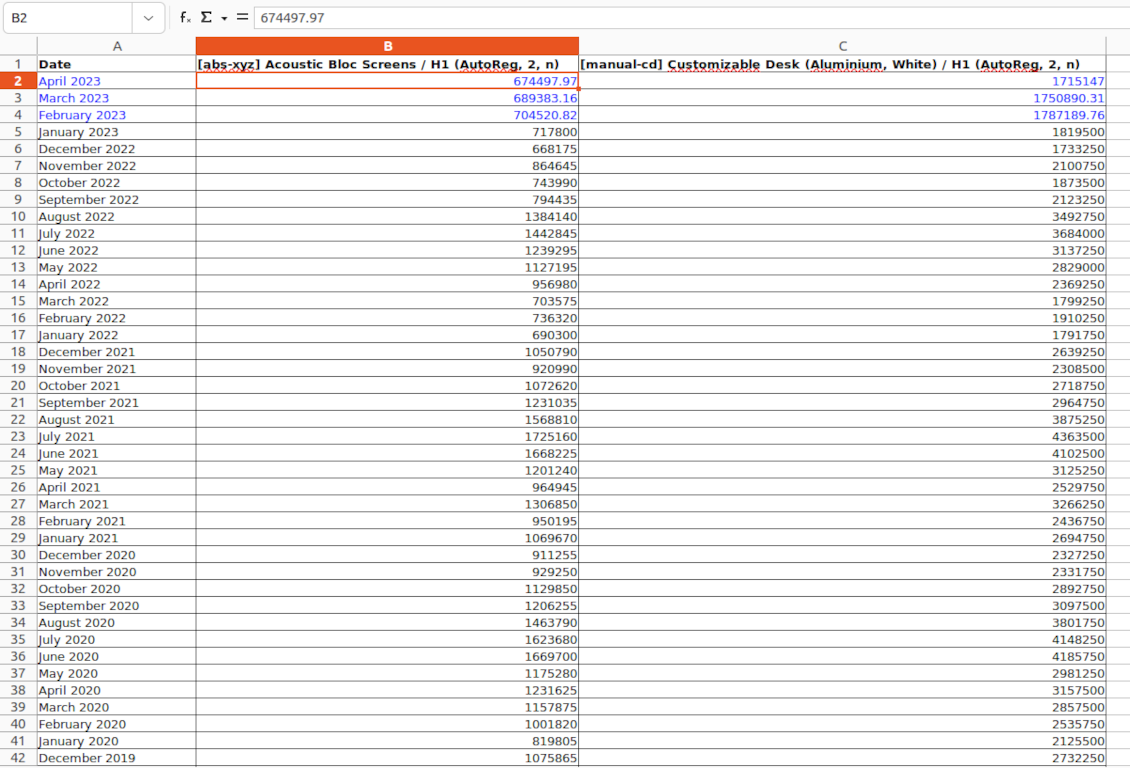
The tool introduces a special interface to instantly calculate sales series. Flexibly switch between different reports and update settings in a few clicks. Control data in pivot, graph, or chart views. Export series as an Excel tabled
Focused analysis
Shrink considered order/quotation lines flexibly or analyze global company sales. Group data into various series
Topical data
Apply time frames for historical data and work with intervals that are of interest to your industry. Work with past and future periods.
Flexible report configuration
-
Introduce as many analytic reports as you need. Each report is based on Odoo's sales lines' data
-
Keep reports to re-use them, instantly switch between reports, or experiment with real-time changes without saving those
-
Show historical and forecast series as a table, line graph, or bar chart, or export data as an Excel table
-
Apply as many and as different statistical models as you want to check. Each stats model will peer its own data series and prediction if the latter is possible. See also the section "Statistical models"
-
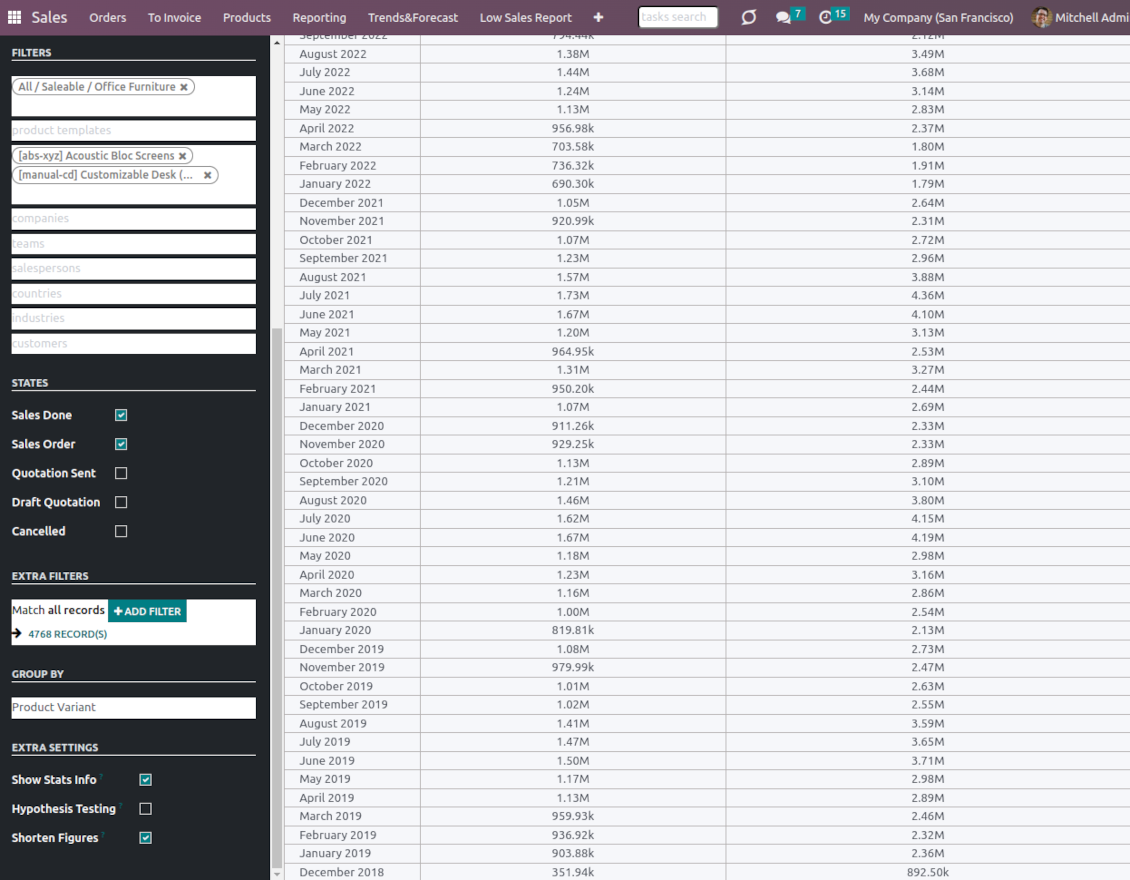
Define the data periods under analysis by entering a start and end. Only sales within this interval will be included in the series
-
Split data series into years, quarters, months, weeks, and days depending on seasons assumed in your industry or business area
-
Select an unlimited number of periods to predict future periods or check hypotheses
-
Grant the right to forecast tools for any salesperson (the group Sales > Sales Forecast)
-
Filter sales data by product categories, product templates, product variants, sales teams, salespersons, countries, industries, specific customers, and companies (for multi-company regimes). Introduce your own criteria based on Odoo's dynamic domain constructor, so shrink analysis by any sale line storable fields
-
Analyze a sales total, an untaxed total, an untaxed total to invoice, gross weight, or volume
-
Introduce a few data series simultaneously with grouping by a product category, a product template, a product variant, an order state, a team, a salesperson, a country, an industry, a customer, or a company
-
Hide/show general statistical measurement of series: count, mean, standard deviation, minimum, maximum, 25%, 50%, and 75% factors
-
Optionally compare predicted values to real historical data if any. See also the section "Hypothesis Testing"
-
Make figures human readable (e.g. 192,217 as 200k) or show them precisely.
Statistical models
-
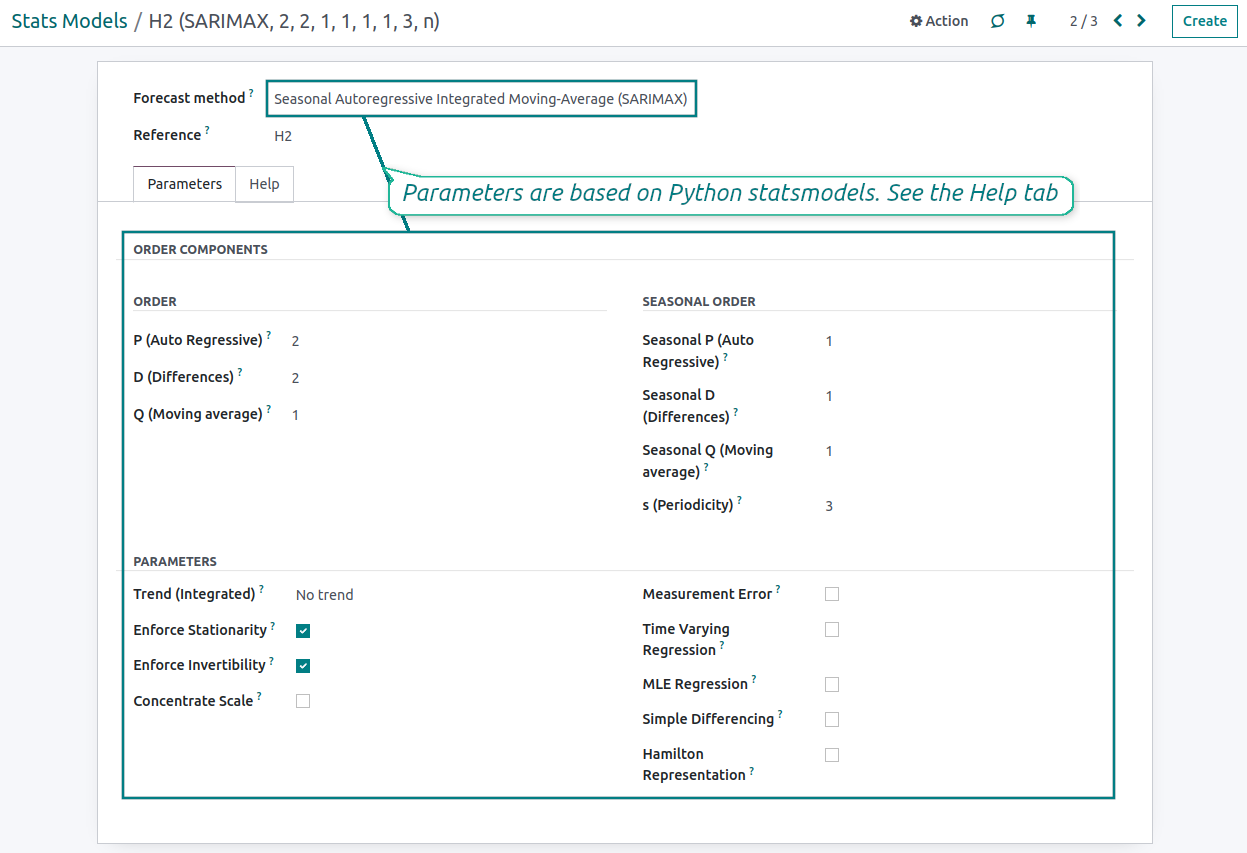
The tool allows calculating sales trends based on predefined statistical models introduced by the Python package statsmodels
-
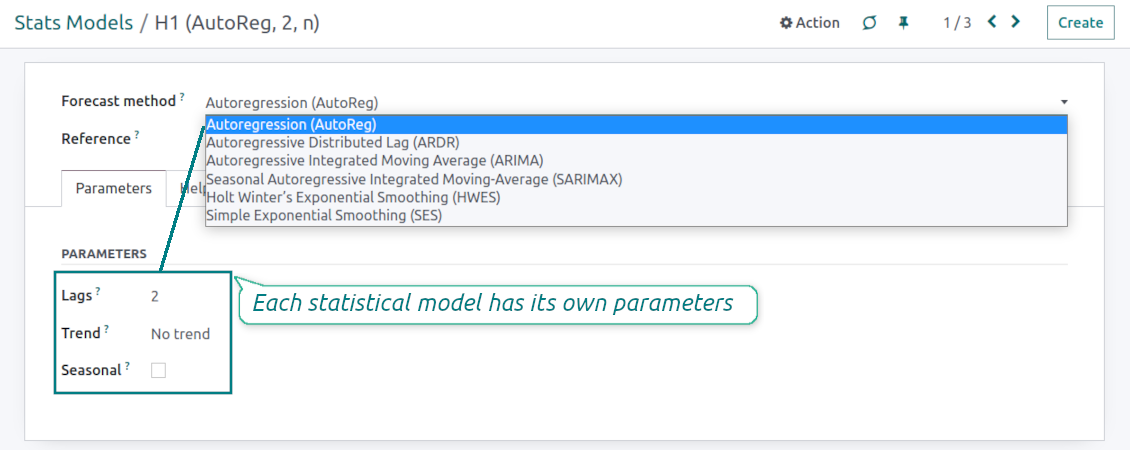
Methods have different complexity, and their own unique parameters, and might be suitable for a definite market or a specific business. The final choice of the model and related statistical parameters is only up to you. Nobody except you can better understand tendencies in your company sales, and hence which methods and factors should be applied
-
Available statistical models are Autoregression (AutoReg), Autoregressive Distributed Lag (ARDR), Autoregressive Integrated Moving Average (ARIMA), Seasonal Autoregressive Integrated Moving-Average (SARIMAX), Holt Winter's Exponential Smoothing (HWES), Simple Exponential Smoothing (SES)
-
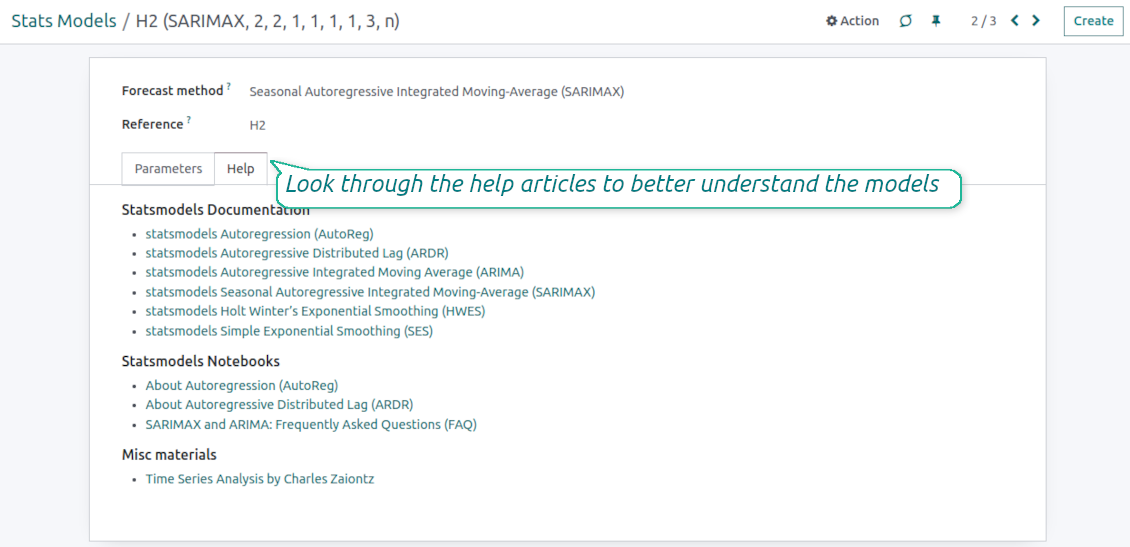
For deep details about what each stats model means and which parameters might be applied, look through the tab "Help" on the stats model form
-
Keep and use an unlimited number of stats models with various parameters. Check, compare, and update those flexibly through the forecast manager interface
-
Often models with specific parameters will not result in any prediction or the prediction will be unrealistic. This is normal, only a deep understating of trends and much experimenting might give a viable forecast for your specific case.
Hypothesis Testing
-
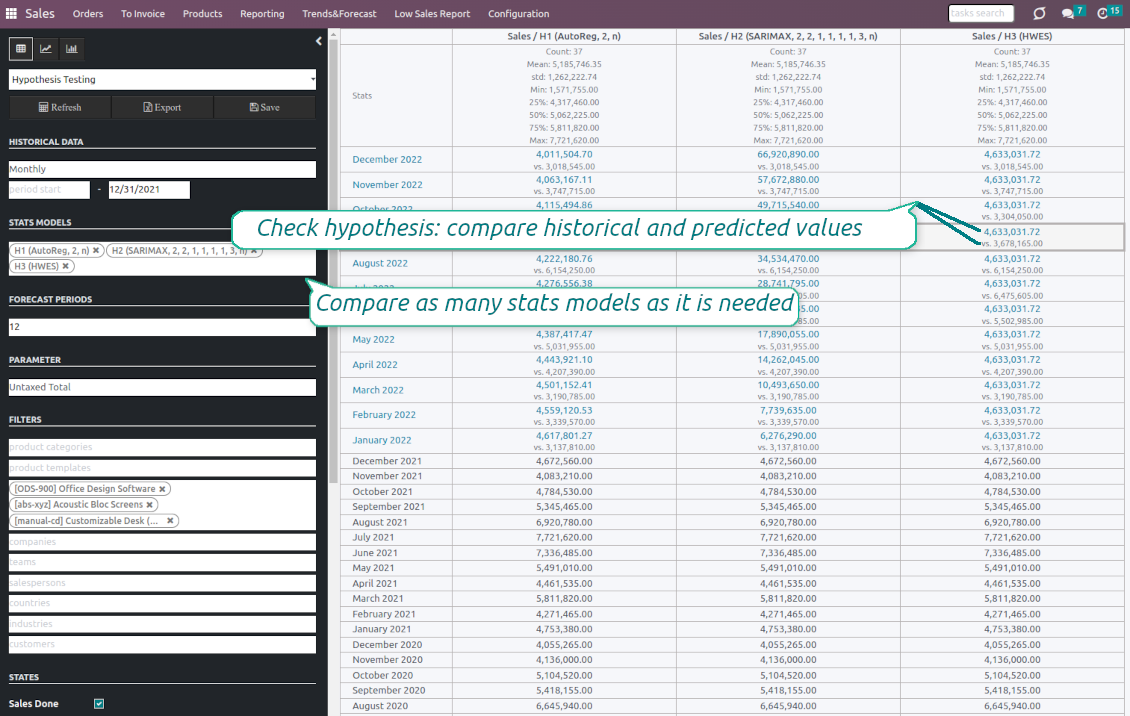
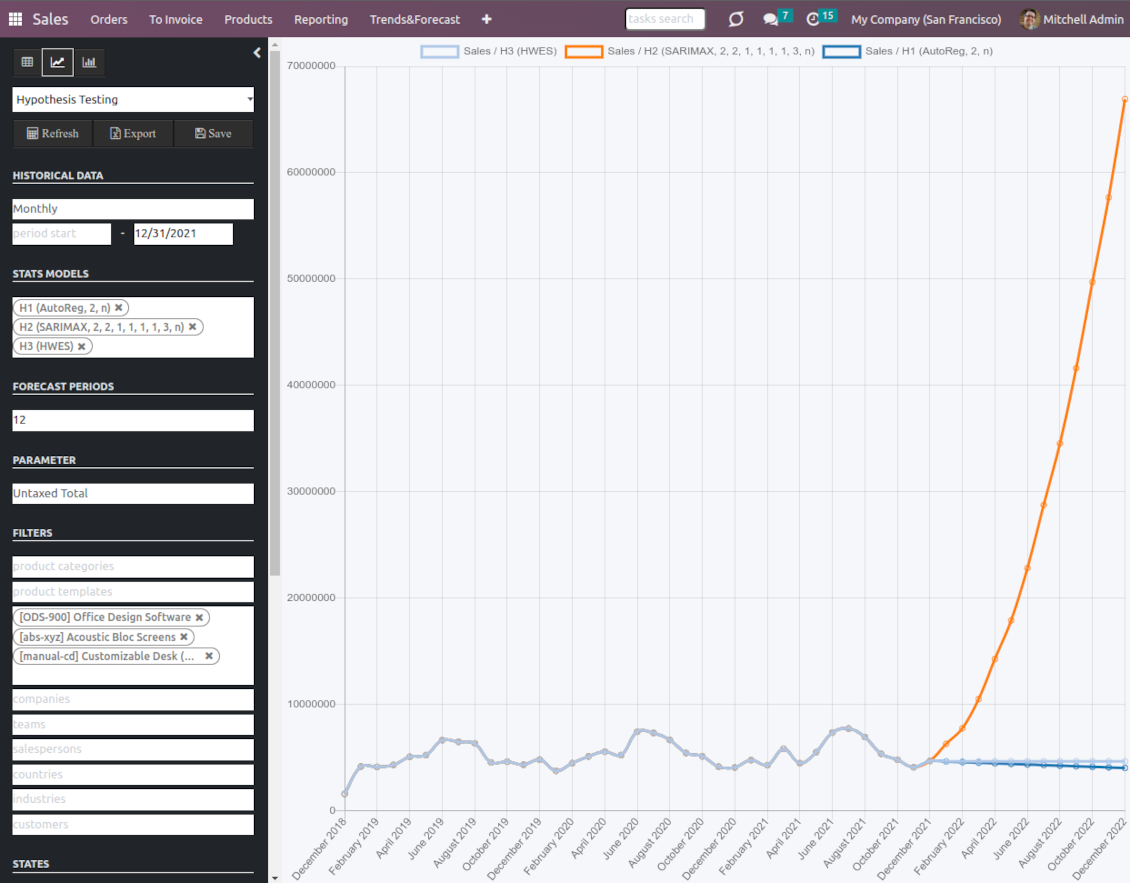
To get a proper prediction, it is usually needed to experiment a lot with statistical models and introduced parameters. To check the results, the app allows compare forecast data with real values
-
To check a certain assumption with historical values, you may make an analysis and prediction for some past periods, and turn on the setting "Hypothesis testing"
-
For example, you have sales orders from 2017 to 2022. Then, you can get report historical data for 2017-2021, and make the forecast for 12 months of 2022. In this way, you will get the prediction for the interval for which you already have actual values. By comparing forecast and actual values, you can decide whether a chosen model and factors are good enough
-
The app allows checking the hypotheses for a few stats models simultaneously. In this way, it is possible to reveal what is actually the most appropriate, or whether experimenting should be continued.
Usage requirements
-
To reveal trends, there should be enough historical sales data. It is senseless to make a forecast based on the last 5 days of sales since no trend cannot be retrieved. Take into account that data should be enough for the chosen filters and for each grouped series
-
There should be not only enough sales lines but also there should be some actual trends. Chaotic data will not result in reliable predictions. To use the app, you should understand which assumptions (e.g. seasonal changes) you check
-
To use the app, you either should have a clear understanding of how statistics works or a will to understand that. Regretfully, there is no way to make a "general" analysis, each specific case is unique and requires its own elaboration.
設定とインストールのヒント: Sales Trends and Forecast Odoo v.16
Python dependencies
To guarantee the tool works correctly, a number of Python libraries are required: pandas, numpy, statsmodels, scipy, xlsxwriter. To install those packages execute the command:
pip3 install pandas numpy statsmodels scipy xlsxwriter
If you run Odoo on Python prior to or equal to version 3.7, please install the following versions of the packages pandas==1.3.5, statsmodels==0.13.1
Server memory limits
Running the statistical analysis and making the forecast is quite a resource-demanding operation. If users face the hanging interface, make sure that server memory limits and timeouts are enough. Otherwise, increase those settings.
に関するよくある質問 Sales Trends and Forecast Odoo v.16
ツールの更新ポリシーは何ですか?
現行の Odoo Apps Store ポリシーによると:
- バージョン 12.0 以前向けに購入したモジュールは、12.0 までの全バージョンにアクセスできます。
- バージョン 13.0 以降、各モジュールバージョンは個別に購入します。
- バージョンに関係なく、購入するとメジャーバージョン内の すべての更新と不具合修正の権利が得られます。
faOtools チームはこれらのポリシーを管理していません。ご質問は Odoo Apps Store の担当者へ直接お問い合わせください。
アプリを Odoo.sh にインストールする方法は?
最も単純な方法は、Odooストア組み込みのワークフローを使うことです:
1. モジュールのページを開き、Deploy on odoo.sh ボタンをクリックします。
2. その後 GitHub ページにリダイレクトされます。アカウントにログインし、'Create a new repo' をクリックするか既存のものを使います。リポジトリはプライベートにしてください。OPL-1 ライセンスのアプリを公開することは許可されていません。必要なら Odoo.sh プロジェクト用に新しい repo を作成します。
3. 次に odoo.sh に行き、Deploy ボタンをクリックします。ポップアップで決定を送信し、'Continue.' をクリックします。これでインストールが始まります。
これらの手順でプロジェクトの本番ブランチにアプリがインストールされます。他のブランチにデプロイする、またはモジュールを更新する場合は、次の操作を行います:
1. Odooストアからアプリのソースコードをアップロードします。
2. モジュールを必要な GitHub リポジトリにコミットします。アプリのフォルダ/ファイルが無視されていないこと(repo の .gitignore に含まれていないこと)を確認してください。リポジトリは odoo.sh が自動作成し、既定で重要な項目(例: /lib)が含まれることがあります。モジュールのディレクトリ、サブディレクトリ、ファイルを例外なくすべてアップロードしてください。
3. odoo.sh プロジェクトの対象ブランチを Deploy するか、 設定がそうなっている場合は自動ビルドされるまで待ちます。
自分のサーバーにアプリをインストールするには?
2. Odoo サーバーを再起動します;
3. 開発者モードをオンにします(技術設定);
4. アプリ一覧を更新します(アプリメニュー);
5. アプリを見つけて「Activate」/「Install」を押します;
6. アプリページにガイドラインがあれば従ってください。
アプリに追加アドオンがあるのに気づきました。後から購入できますか?
はい、もちろんです。同時に Odoo は依存関係をすべてカートに自動追加するので、二重払いを避けるには既に購入したツールを除外してください。
アプリを Odoo.sh にデプロイしたらテストで警告/エラーが出ます
赤/オレンジの警告はアプリの機能に影響しません。残念ながら、標準の自動テストがアプリの目的と衝突する動作を想定するため、モジュールが通らないことがあります。たとえば価格計算を変える一方、標準 Odoo モジュールのテストは最終価格を標準アルゴリズムと比較します。
まず、デプロイ済みデータベースの機能を確認してください。すべて正しく動いていますか?
それでも警告が実機能に影響すると考える場合はご連絡のうえ、インストールログ一式とデプロイ済みモジュールの全一覧(コアおよびサードパーティ含む)を送ってください。
アプリを御社から直接購入できますか?
いいえ、ツールは 公式の Odoo アプリストア.
割引をいただきたいです
残念ながら、個別価格を提示する技術的手段が ありません。
Odoo Online (SaaS)データベースにアプリをインストールできますか?
いいえ、サードパーティアプリは Odoo Online では使えません。残念ながら Odoo SaaS がその可能性をブロックします。
ツールは他のアプリに依存しています。それらも購入すべきですか?
はい、ツールが正しく動くには依存関係に記されたすべてのモジュールが必要です。アプリページの価格には必要な依存関係がすでに含まれています。
モジュールの米ドル価格はいくらですか?なぜ変わりましたか?
モジュールの価格はユーロ建てです。Odoo ストアは内部為替レートで他通貨に換算します。そのため為替が更新されると米ドル価格が変わることがあります。
英語以外のアプリ・サイト文言は AI 支援で作成され、 公式の Odoo 翻訳に揃えています。誤りを見つけたら、 翻訳の正確さについてチケットを送る 修正します。
Odoo デモデータベース(ライブプレビュー)
このアプリでは無料の個別デモデータベースをご用意できる場合があります。
ご連絡に電話番号やクレジットカードは不要です。30 秒以内の短いメール登録だけです。
ご依頼に応じて個別のライブプレビューデータベースを用意します。約2週間、テストや前提の確認ができます。
不具合報告
不具合や一貫しない動作があれば、遠慮なくご連絡ください。購入から60日以内の修正を保証し、その後もツール改善に力を入れています。
ご連絡に電話番号やクレジットカードは不要です。30 秒以内の短いメール登録だけです。
リクエストにはできるだけ多くの詳細を含めてください:スクリーンショット、Odoo サーバーログ、問題の再現手順の完全な説明など。通常、問題の作業計画の作成(不具合が確認された場合)または実施すべき内容の案内(それ以外)には数営業日かかります。
公開の機能リクエストとモジュールのアイデア(無償開発)
ツール改善への意欲は強く、フィードバックには感謝します。要件が広く役立ち、効率よく実装できる場合、チームは To-do リストに加えます。
このような To-do リストは定期的に処理され、追加料金は発生しません。期限や最終デザインは約束できませんが、投資とリスクなしで望む機能を得る良い方法になることがあります。
ご連絡に電話番号やクレジットカードは不要です。30 秒以内の短いメール登録だけです。

The tool to flexibly structure Odoo attachments in folders and synchronize directories with cloud clients: Google Drive, OneDrive/SharePoint, Nextcloud/ownCloud, and Dropbox. DMS. File Manager. Document management system
398€

The tool to automatically synchronize Odoo attachments with OneDrive files in both ways
487€
The tool to build a deep and structured knowledge base for internal and external use. Knowledge System. KMS. Wiki-like revisions.
398€
The tool to set up KPI targets and control their fulfillment by periods. KPI dashboards. Dashboard designer. KPI charts

The tool for time-based service management from booking appointments to sales and reviews
398€
The tool to automatically synchronize Odoo attachments with Google Drive files in both ways
487€
The tool to make sure required jobs are carefully done on each CRM pipeline stage. CRM checklists

The tool to keep complete and easy-reach opportunities' contact information