About KPI Balanced Scorecard
KPI Balanced Scorecard is an Odoo app, which allows users to set up KPI targets and control their fulfillment by periods. The app introduces a convenient KPI dashboard to manage companies and personal targets. It helps to organize work as a set of periodic goals and to control those goals in any business or functional area. For that purpose:
- The app introduces a clear system to get Odoo storable details: a count of records, a sum or an average of numeric fields, or even pure Python code.
- Actual values are re-calculated by the special Odoo cron job. So, it is always possible to understand which KPIs require more attention in real time at first glance.
- You can share KPI targets with interested users to organize a transparent dashboard of goals: from global to particular ones.
- It is possible to consider only those KPIs that are of interest: for example, only sales-related or of a definite user. Hierarchy allows highlighting targets with indicative padding for an instant overview of sub-KPIs.
- Help hints are available for most objects to simplify KPIs setup (turn on/off help tabs through the app configuration page)
- The module supports the multi-company environment, and, therefore all KPI calculations and settings are configured for each company separately.
Set KPI Targets by periods
Drag and Drop interface for KPI formulas
Use any Odoo data to calculate KPIs
Auto and regularly updated KPIs
Concepts and terms
Here you can find all the terms that were used in the documentation.
KPI (KPI Formula, Key Performance Indicator) - the formula/instruction for Odoo that defines the way to calculate figures based on existing Odoo data and settings. This central configuration object introduces the tool to construct mathematical expressions in a user-friendly manner through drag and drop. These are the examples of KPI: Total Sales in Europe, Done Tasks per Day of John Brown.
A KPI Period - a time frame for which companies set their targets to control performance (in a similar way as financial performance is controlled within accounting/fiscal periods). You can set periods of any length and for any date, usually some yearly (2024, 2023), quarterly (Q1 2024, Q2 2024), monthly (Jan 2024, Feb 2024) approach is applied. KPI Targets are calculated for each specific period.
KPI Target - actual company goal based on specific KPI and KPI period. It allows setting a planned KPI value, so it will automatically calculate a real value based on Odoo data and the KPI formula for this KPI period. KPI targets are set regularly for each analytic period by responsible managers and might be shared among interested users to control results continuously. These are the examples of KPI Targets: Total Sales in Europe in 2024 (target: $1,000,000; actual: $800,000); Done Tasks per Day by John Brown in July 2024 (target: 1,5; actual: 2).
Basic measurement - the core configuration object used for retrieving actual KPI values from Odoo data. Although basic measurements are not used for formula constructions, they are required to prepare any sort of formula variables. These are the examples of basic measurements: Aggregated Sum by Done Sales Orders (the period is defined according to a sale order date); The Total Number of Tasks in the State ‘done’ (the period is defined according to the last stage update date).
Python code measurement – a specific type of Basic measurement, which requires technical knowledge and allows the creation of instructions for the module on how to get the data from Odoo.
Measurements (Variables) - a specification of a basic measurement. The key idea of distinguishing KPI Variables from Basic measurements is to simplify data preparation. You define 'Total Sales' once, and then unlimitedly use it for 'Sales Europe', 'Sales John Brown', 'Website Sales', etc. Measurements are used to prepare KPI formulas (available for drag and drop).
Constant - the special type of KPI Variables used when data can not be retrieved from modules and/or when figures remain the same during the whole period. For example, 'Total Investments' or 'Number of Employees' are often frozen for a specific period. Constants are used to prepare KPI formulas (available for drag and drop).
KPI Scorecard - the special interface to configure and control targets, which are shown according to a chosen period. The interface allows you to choose, close, and re-open periods; set, substitute, and filter KPI Targets; see KPI History.
A KPI Category - KPIs storage, which is used for convenient navigation over KPIs and managing access rights to them. To control KPIs related to specific areas combine them into corresponding categories. For example, 'Sales KPIs' and 'Team Europe KPIs'.
A KPI Tag - is a special object to structure KPI targets, used for convenient management and search.
KPI History – the special interface of a specific KPI target to control its KPI values by all periods, including a graph of similar periods.
Closing KPI period – the special action to stop KPI re-calculations and finalize the period results (can be compared with closing a fiscal year).
KPI User - any internal user, that has access either to see or edit one or several KPIs or KPI Categories.
KPI Manager - the assigned user or users, that have full rights for all KPIs disregarding the settings.
The difference between KPI and KPI Target
Two important concepts are used in the module: KPI and KPI Target. They have significant differences.
KPI or Key Performance Indicator is a formula, that represents a measurable value that demonstrates how effectively a company is achieving key business objectives. It is used to evaluate the success of reaching a company's goals. It may focus on the overall performance of the business, of some smaller departments (sales, appointments, HR...), or even particular employees.
The company's performance based on a particular formula is stated in the Single View Interface in the column 'Actual Value' (see Single View Interface).
A KPI Target is a goal, a particular number/amount. It has guidelines and requires a formula to be calculated. Therefore we can imagine it as Formula (KPI) + Period.
In the Single View Interface, KPI Targets are stated in the column 'Target Value'(see Single View Interface).
KPI Target is put manually, by the responsible for that person. To be valid, the goal should be SMART. The letter in the abbreviation SMART stands for:
1) Specific (related to a particular Odoo model)
2) Measurable (see Measurements)
3) Achievable (possible to fulfill)
4) Relevant (acute for the company development)
5) Time-specific (see Periods).
KPIs (key performance indicators) - are measurements that aim to evaluate the organizational or personal success of a definite activity. Different companies have different KPIs depending on their strategy and business area. However, all KPIs have a common core attribute: they must be measurable within a target period. To that end, KPIs allow the construction of formulas to retrieve Odoo data sets and process those into real figures. Formula preparation is as simple as it is to write down a mathematical expression: just drag and drop formula parts in the right order with correct operators. KPIs, KPI periods, and KPI targets KPIs represent the list of success figures you may use to plan your company activities. Simultaneously, measurements are almost senseless unless you have target values for those KPIs. That is possible only within a time-constrained period. 'Sell as much as you can' is not a goal, while 'Generate 100,000 Euro Revenue in the year 2024' is a good aim for a salesperson, for example. To that end, KPI periods are introduced.
A combination of a KPI and a KPI period results in a KPI target. Exactly with those targets you work on the scorecard interface. For each KPI you would like to manage in this period, you should define a planned value to compare those to the actual at the end of the period.
So, a KPI itself defines how to compute the actual value for a period and how to estimate the result ('the more the better' or 'the less the better'), but does not assume setting targets. The latter should be done for each period.
Basic Measurements
Basic measurement is the core object used for retrieving actual KPI values from Odoo data. Although Basic measurements are not used themselves for formula constructions, they are required to prepare any sort of Variables.
A Basic measurement represents the most general instructions for the module to find the data, while Variables specify those. For example, 'Total Number of Sale Orders' should be a Basic measurement, while a narrower 'Number of Quotations of the Sales Team Europe' is recommended to be a precision of that basic measurement - Variable. Each Basic measurement might have an unlimited number of linked Measurements (Variables).
By default, the KPI module contains some Basic measurements, which you can use to create Variables.
To create a Basic measurement:
1. Go to Measurements > Basic Measurement
2. Click 'New'
3. Type a name and optionally add a model type before it (for example [purchase]) to find the measurement quickly
4. Choose a KPI Type, to activate a set of further fields and define the way the module will get the information for calculations (for example, the records can be counted or the value of particular record fields will be counted)
5. Chose a Model, an Odoo object from which the data will be taken (for example, Sale Orders, Purchases, Quotations)
6. Based on the KPI Type you will see a set of other fields
7. Add a 'Measure field' for the analysis (the fields from which the module will take the data to count, to calculate the sum of records or count the average value of the fields (Only for types: 'Sum of records field', 'Average of records field')
8. Add one or several date fields (those are fields, that will be taken into consideration in the calculations when the period is stated, for example, order date or delivery date). If you choose several fields, then, for the record to be considered for calculations, both of those fields should be within the period
9. Add a company field for the analysis, if you work in a multi-company environment (for example, if you have 2 or more companies, you may want to calculate KPI for each of them, so for the app to be able to distinguish companies, the field should be added as you create a Basic measurement)
10. It is possible to add some filters, but it is recommended to add only basic ones and then, specify them while creating a Measurement (Variable) (thus, your Basic measurement will be more general and so, you will have more possibilities for creating a Variable. For example, you created a Basic measurement 'Sales Total', which you can use to create Variables: Sales Total Team America, Sales Total Team Europe, Sales Total John White...)
The first field 'KPI Type' defines how Odoo data should be calculated:
1) Choose the KPI Type 'Count of records', if you want to count all matching records, for example, the number of registered leads or the number of posted customer invoices
2) Choose the KPI Type 'Sum of records field', if you want to sum up a certain number field of records, for example, the sum of the total amount of all orders or the sum of paid taxes by invoices
3) Choose the KPI Type 'Average of records field' to get the average of record's number fields, for example, average planned hours per task or average days to assign a lead
4) Choose the KPI Type 'Executing Python code' to compute any sort of figures based on any Odoo data. This type requires technical knowledge (see Executing Python code)
The second field 'Model' defines an object, from which the information is taken. It assumes that you define how records should be searched and which record fields should be used for computations. For example, 'Sales Order', 'Task', 'Lead/Opportunity'. You can also rely on standard or custom objects (including those created in the Odoo studio)
The third field 'Measure field' is required only for the calculation of the KPI types 'Average' and 'Sum'. It defines which figure you use for calculations. For example, 'total amount' of Sales Analysis Report or 'work hours of tasks'. It is a 'Column' in the database table related to the model above.
Depending on the model that you choose, the list of fields varies. For example, the model - 'Articles' has such measure fields as likes or dislikes number, referred to in emails; and the model - 'Sale Order' has such fields as total, delivery orders, and invoice count.
The fourth field 'Date fields' is required to understand whether a specific document type relates to a considered period, so, how to distribute objects by time intervals. It assumes that you define how records should be searched and which record fields should be used for computations.
Each model has its list of available date fields. The object's fields, which contain information about time can be chosen. For example, for tasks, you might use the create date to analyze jobs registered within this KPI period (e.g. 'Total number of tasks created in January 2024'), order date for a sale order, revision date for an article, and reserved time for an appointment.
For example, you create a Basic measurement 'Total Sales' for the model 'Sales Order'. In the field 'Date Fields' you choose 'order date'. Then, after creating the corresponding Variable and KPI Formula, you set a KPI Target to receive 100000$ for the Period 'The Year 2024'. The module will get the instructions, to consider only the sale orders, which were created during this particular period. Those sale orders, within the period, will be used for calculations of the actual value.
It is also possible to apply a few date fields, so matching to ALL of those date objects will be considered(e.g. 'Opportunities opened and won in January 2024').
If date fields are not specified, the calculation will consider all records for all times regardless of the period. For example, you created the Basic measurement 'Total Sales' and left the date field empty. After setting the KPI Target, the module won't get any instructions on how to filter objects by dates, or where to get the information about the date. That means the KPI Period would not influence this Basic measurement. Therefore, all existing sale orders disregarding the period will be used for calculations.
The fifth field 'Company Field' would be needed for a multi-company environment. This field gives instructions to the module, where to search for the related to a company model.
Even after choosing this field on the Basic measurement level, you can create a global Variable, that will count the result disregarding the company. For that, leave the field 'Company' empty.
For example, you create a Variable 'Total Sales Chicago' based on the Basic measurement 'Total Sales' and in the field 'Company' choose the Company Chicago. If you didn't choose the field, from which the module will decide to which company an object relates (while creating the Basic measurement), then as you set the KPI Target, you still will see the global result - the total sales of all teams.

The section 'Filters' shows you records, which relate to the chosen module and will be used for getting the value for calculations. 'Filters' also allow you to restrict records set by any stored field. For example, you may calculate the count of only won opportunities based on stage settings or only posted customer invoices based on journal entry type and state.
Let's add some filters to create a Basic measurement 'Posted Customer Invoice'. In this case, we need to filter records by type and status. The first filter is 'Move Type = Customer Invoice', and the second one is 'Invoice Status = Open'. Above the filtering options, we can choose, whether the records should match ALL or ANY of our filters. As we chose ALL, only records, which correspond to both move type and invoice status will be considered for further calculations. Click on the button 'N records' to see all the matching invoices.
It is recommended to use 'Filters' for low-level filtering in Basic measurements and then specify them in KPI Variables. This way, you avoid double work and create more Variables based on one Basic measurement.
Also, avoid adding dates to the filtering options, as then you will be required to change dates every time you create a KPI Target for a new Period. If you don't add dates' restrictions as a filter, you will be able to simply 'Substitute Targets' and records will be analyzed based on the fields chosen in the fourth field 'Date Fields' (For example, 'Create Date') (see KPI Scorecard).
Executing Python code
'Python code' is a special type of basic measurement. This type requires technical knowledge but lets you compute any sort of figures based on any Odoo data without restrictions. Such measurement might be any Python basic script with the possibility of SQL queries (through using 'env.cr') In calculations you may rely upon the special variables: 'period_start' (the first date of the period), 'period_end' (the last date of the period), 'period_company_id' - res.company object for which Odoo makes calculations at the moment (according to a KPI period under consideration) Correct Python code assumes saving the value into the special variable 'result'.
Basic measurements of the type 'Execute Python code' can't be any more specified, since they do not relate to any records. However, such measurements should have a single KPI variable linked.
Basic Measurements Examples
Based on one Basic Measurement you can create multiple Variables to use in different KPIs (see Measurements (Variables)). Here are some Basic Measurement Examples, that you can create:

The Purpose of the Basic Measurement is to count all Leads and Opportunities. This way you can find out the exact number of all Leads and Opportunities that your salespeople processed.

The Basic Measurement that sums the total value of All done Sale Orders. Choose the 'Measure field' - 'Total', so the module will sum the value from it. In order to consider only 'done' orders, add 2 Filters: Status = Sales Order; Status = Sales Done. Make sure that records should match Any of those filters. This way you can find out how much did the company earned on sales.

The Purpose of the Basic Measurement is to count all posted customer invoices. In the field Filters, choose: Type = Customer Invoice and Status = Posted. This way you will know how good the sales process goes.

The Basic Measurement that sums the total value of All Purchases. Choose the 'Measure field' - 'Total', so the module will sum the value from it. This way you will know how much money was spent on the vendors products for a particular period of time.

Count all the products types in stock. This way you can find out how many product types are available for sale.

The Basic Measurement to count for what number of days all tasks were completed. This way you can find out how much time your workers needed to finish their work.

When the time of the appointment isn't set and can vary, create this Basic Measurement to track the Average time of an appointment. For example, what is the average time, that users book to rent a car. This way you can find out what services require more time and therefore introduce interesting discounts to make other appointments last longer.

Use the Basic Measurement The Total Number of Likes to assess the quality of the articles in general. To take into consideration only popular articles, add a Filter Views > 10. This way you can see the users activity on the article's page and whether the article's are successful overall.
Constants
KPI Constants are the special type of KPI Variables used when data can not be retrieved from modules and/or when figures remain the same during the whole period. For example, 'Total Investments' or 'Number of Employees' are often frozen for a specific period.
In comparison to measurements, KPI Constants are fixed and they do not depend on actual Odoo data. This allows the introduction of the figures which can not be retrieved from modules and/or which should remain the same during the whole period. For example, you might set the 'Total Size of Investments' to calculate return on investments, or the 'Number of Salesmen' to get sales revenue per person.
To create a Constant:
1. Go to Measurements > Constants
2. Click 'New'
3. Type the constant's title
4. Put the global value (the number which will be used for all periods, except for the specified ones)
KPI Constant value might be defined for each period.
Besides, for each period the app automatically tries to calculate a parent period. In one period is fully inside another one, the latter is considered as a parent for the former. For example, Y2024 (01/01/2024 - 12/31/2024) is a parent of Q3 (07/01/2024 - 09/30/2024); Q3 is a parent of July (07/01/2024 - 09/30/2024); but for 06/30/2024 - 07/31/2024, the parent would be Y2024, since this period is not fully inside Q3.
If there is value neither for this period nor for its parent, the global value would be applied.
To define a value for a particular time frame:
1. Start creating or editing a Constant
2. Find the tab 'By periods' and click 'Add a line'
3. Choose an existing period and type the value for this period, that will be used for calculations instead of the global value
As an example, let's create a constant 'Number of Employees'.
The Global Value - the general number of employees - is 20. This value will be used for all calculations containing the constant 'Number of employees'.
For the year 2024, however, we define the value as 21 employees.
But during the year we had some changes. In the first quarter of 2024, the company had 18 employees. During the second quarter, one more employee was hired, so we had in total of 19 employees. So let's add the value for these periods. Now, 18 is used for calculations for the first quarter of 2024 and 19 for the second.
As we don't state the number of employees for the third quarter, the value for its parent - Y2024 - '21' will be used for calculations.
For quarter 1 of 2024, there is no value and it doesn't have a parent value, so the global value - '20' would be applied.
Measurements (Variables)
Measurement (Variable) - is a specification of a basic measurement. The key idea is to simplify data preparation. You define 'Total Sales' once, and then unlimitedly use it for 'Sales Europe', 'Sales John Brown', 'Website Sales', etc.
Specify Basic measurements through the Odoo built-in domain constructor, which lets to filter by any storable attributes. Add more filters to Basic measurement by creating a Variable.
For example, create a Basic measurement 'Sales Count' for the Model 'Sale Order', which counts the number of sale orders. The Basic measurement uses the KPI Type 'Count of records'. Apply filters 'Status = 'sale'; Status = 'done'' to the Basic measurement. Based on the Basic measurements you can create other Variables: Sales Count America, and Sales Count Europe using the filter 'Sales Team > Sales Team contains 'Europe'/ 'America'. Or you can create a Variable to count sales of a particular salesperson, by the filter 'Salesperson ID = 2'.

Another example is based on the Basic measurement 'Opportunities: Average Expected Revenue' for the Model 'Lead/Opportunity', which calculates the average revenue and uses KPI Type 'Average of records field'. Based on this measurement you can create a Variable to count the average expected revenue only on the stage 'Won'. For that purpose, use the Filter 'Is Won = Won'. You can also create a Variable to see the expected revenue of a particular salesperson with opportunities only on the Won stage. You can use the same Filter 'Is Won = Won' and add one more 'Filter Salesperson ID = 2'.

Based on one Basic measurement you may create as many Variables as you need. Or you can create one Variable, by simply linking it to Basic measurements (Basic measurements are not used to create a formula by themselves). For example, create a Basic Measurement 'Total Sales' and link it to a Variable 'Total Sales'.
An exception is Basic measurements of the type 'Execute Python Code'. As they work on the code level, they cannot be anymore specified. So there can be only one linked Variable (see Execute Python Code).
There are two default Variables, that you can use for creating formulas within the time frame. You can find them right in the formula wizard (see KPI Scorecard). Those are:
1. 'Period Days' (the number of days in the period). KPIs with this Variable calculate the result based on the number of days in the current period. For example, Q3 (07/01/2024-09/30/2024) Period Days would be 92 days.
2. 'Days Passed' (the number of passed days in the period). KPIs with this Variable calculate the result based on the number of days passed in the current period. For example, Q3 2024 on the 15th of July would be 15 days, on the 1st of September - 62 days, and on the 30th of September - 92 days.
For example, you can see the Total Sales per Day. Both Variables apply to this KPI, but in the first case, you will see the accurate result only on the last day of the period, as it will compare the actual value with the total number of days in the period, even if the period is a month and at the moment only a few days have passed. The Variable 'Days Passed', on the contrary, will always show a more accurate result as will compare the actual value with the number of currently passed days. And each day the number of days will change (+1).
Let's create a KPI 'Total Sales' with the Variable 'Period Days', to find out how much you earn for a day. Set the KPI Target for the 3rd quarter of 2024. The length of the period is 92 days, so the Total Sales will be compared with the number of days in the period. At the beginning of the period, the results will be not accurate as a few days or weeks have passed and the period is not yet over.
Let's create the same KPI, but now with the Variable 'Days Passed'. Here the Total Sales will be compared with the number of already passed days. This number is dynamic and it changes as the days go by. So, we set a KPI Target for the 3rd quarter of 2024. Today it is the 15th of August, and therefore only 46 days have passed. Today the Total Sales will be compared with 46 days. Tomorrow with 47 days. So, the result is much more accurate, than when we use the Variable 'Period Days'(which is accurate only on the last day of the period).

Variables are used to create a KPI. The KPI may relate to a particular company. As you create a Variable choose the company it relates to, so only the objects related to the company will be considered for calculations. Therefore, you will be able to calculate, for example, the 'Total Sales' of each of your companies separately. For instance, create a Variable 'Sale Team America > company USA' and 'Sales Team Europe > company Belgium' and assign each to the corresponding company. If you don't specify the company, then KPI Variables would be available for all users of all companies. Otherwise – under a certain company, users would be able to see only those related to that company objects.

To create a Variable:
1. Go to Measurements > Measurements (Variables)
2. Click 'New'
3. Type the name of the Variable
4. In the field 'Measurement' choose a Basic measurement
5. Choose a company or leave the field empty, to make this Variable global
6. Optionally add some filters
From a Basic measurement form view, you can access all linked variables:
1. Go to Measurements > Basic measurements
2. Open any Basic measurement
3. In the top right corner of the Basic measurement you will see the number of Variables, based on it
4. Click on the button to see the list of Variables
5. Click on any Variable to see its card
Variables Examples
Here you can find some possible Variables that specify useful Basic Measurements (see Basic Measurements Examples).
1. Basic Measurement - Leads and Opportunities Count


You can separate Leads from Opportunities, to see the result for each separately. For that add the Extra Filter Type = Lead or Type = Opportunity.

See only Leads and Opportunities with high probability. You can manually set how high it should be. Add the Extra Filter Probability >= 70. 70 is the percent number.

See only won Opportunities, to compare their number by periods and track the effectiveness of work. Add the Extra Filter Is Won = Won.
2. Basic Measurement - Confirmed/Done Sale Orders Total

Even if there is no need to specify the Basic measurement, match it to a Variable, so it was visible in the formula wizard. As the Basic measurements are not used for creating a formula (see Basic Measurements). Create a Variable 'Total Sales' to see the amount of money that was earned on sales.

Specify the Basic measurement to see the Total, that a particular team earned. For that add the Extra Filter with the name of the team Sales Team > Sales Team contains 'Europe'. If you have several teams and want to see the Total result by teams you need to create a Variable for each team separately.

You can also see the result per each salesperson, to stimulate employees to sell more and get some benefits. For that add the Extra Filter with the person's ID Salesperson > ID = 9.
3. Basic Measurement - Customer Invoices Count

Specify the invoices by their status. To count all the posted invoices add the Extra Filter Status = Posted.

Track the number of cancelled invoices, to take timely measures and find out what is the problem, if too many were cancelled. Add the Extra Filter Status = Cancelled.

Find out how many invoices with the high Total amount were created. For that add the Extra Filter Total > 100.
4. Basic Measurement - Purchase Order Total

Even if there is no need to specify the Basic measurement, match it to a Variable, so it was visible in the formula wizard. As the Basic measurements are not used for creating a formula (see Basic Measurements). Create a Variable 'Purchase Order Total' to see the amount of money that was spent on products.

If you have vendors from various countries and pay them in different currency, you can add, for example, the Extra Filter 'Currency contains US'. This way only the purchases in US dollars will be taken into consideration.
Simultaneously, it is also possible to convert all currencies to the default company one to see the result in it. In this case, to calculate the purchase total regardless the currency, you can set another Basic measurement and Variable.
To that end edit the Basic measurement or create a new one and change the Model to 'Purchase Report'. This kind of Model and similar ones (like Sale Report, etc.) are insensitive to the currency. So, the total will be summed already in default company currency.
For example, create a Basic measurement 'Purchase orders total in default currency', and choose the Model 'Purchase Report', add an Extra Filter by the country or vendor is you like (e.g. Country contains America) and after the calculations the result will be shown in the default currency.


Specify the Basic measurement to calculate the money spent for the products of a particular vendor. Add the Extra Filter Vendor = 'Azure Interior'
5. Basic Measurement - Working Days to Close

Connect Basic measurement to a Variable with the same name to see the number of days that the company spent to finish all the projects.

Create a Variable to see the number of days that Anita Oliver needed to finish the assigned to her projects. For that, use the Extra Filter with the workers ID 'Assigned To > ID = 9'.

Create a Variable to see the number of days that the company spent to finish the particular project. For that, use the Extra Filter with the Project's title 'Project > Name = 'Software Continuous Development'.
6. Basic Measurement - Products in Stock

Specify the Basic measurement to count stocks of the products, that have incoming inventories to a particular warehouse in a specified period. For that add the Extra Filter with the location title Location contains WH/Stock.

Count incoming inventories of only expensive products in your shop. For example, those that price is more than 100 $. For that add the Extra Filter Product > Sales Price > 100.

Calculate incoming inventory of specific product or products. Add the Extra Filter with the product's name, for example Product contains Large Cabinet.
7. Basic Measurement - Average Duration of an Appointment (for the module Universal Appointments)

If you hold various appointments in different languages that vary in time, you can filter them by the language and calculate the average time of an appointment. The language of the appointment is decided based on the language of the appointment's partner. Add the Extra Filter Language = English.

Calculate the average time for an appointment for a particular service. To see for which service customers book more time. Add the Extra Filter with the name of your service Service = Car Rent Class C.

Track for which of your employees customers book more time. Add the Extra Filter with the responsible for the appointment person Responsible = Anita Oliver.
8. Basic Measurement - The Total Number of Likes in an Article (for the module KnowSystem)

Track the number of likes, for the articles, which are published. This way you will be able to track likes for only those articles, which can be liked by both internal users and portal users. Add the Extra Filter Is Published is set.

See the total number of likes for the articles with a particular tag. You can later compare, articles with what tag gets more likes and therefore is more popular among users. Add the Extra Filter with any of your tags, for example Tags > ID = 3. You can find out the required tags's ID as you open the tag from the tag's menu, in the address line 'odootools.com/web#id=3...'.

You might want to consider the number of dislikes to an article, while counting the total number of likes. Add the Extra Filter Dislikes Number < 5. With this Filter, only the articles that have less or equal 4 dislikes will be considered for calculations.
KPI Periods
KPI Scorecard assumes that you might not only have an overview of actual figures but you can also compare those to real targets. However, goals should be time-constrained (for example, 'Sell as much as Possible' is not a goal, while 'Generate 100,000 Euro Revenue in the year 2024' is a good target for a salesperson). That is why KPI Periods are introduced.
A KPI Period is a time frame for which companies set their targets to control performance (in a similar way as financial performance is controlled within accounting/fiscal periods).
The app allows setting periods of any length including intervals that intersect each other (and even the Past periods). For example, you can create some ordinary periods by years, quarters, months, weeks, and days like 'The Year 2024', '1st Quarter of 2024', '2nd Quarter of 2024', 'September 2024' etc. Or make unusual periods - 'September 1st to 17th' and 'September 7th to 30th'.
When periods cross each other like in 'The Year 2024' and '1st Quarter of 2024', the objects that were created during the crossing time are used for calculations in both periods. For example, we had 100 sales in 2024, and 20 of them related to the first quarter of the year.
There are two ways of creating a period: through the separate menu or right from the KPI Scorecard interface.
To create the period from the KPI Scorecard Interface:
1. Click on the button 'New'
2. Write the title of the period
3. Choose dates
4. Optionally choose the period to copy the KPI Targets from (to avoid the double work and not to create them again)
5. If you have more than one company, choose the one for which you create the period (in multi-company mode: it cannot be global, should be created for each company separately)
To create a period from the separate menu:
1. Go to the tab 'Periods'
2. Click 'New'
3. Type the period's name
4. Choose the start and end date
5. In multi-company mode choose the company
6. Optionally add some KPI Targets right from here
The chosen dates will be used to calculate the KPI actual value. For example, a KPI formula might include a basic KPI measurement for the total amount of sale orders, while the date field of this measurement is defined as 'Order date'. Then, only sale orders, whose order date is within the period, would be taken into account. Thus, the KPI Scorecard would show the total revenue for a given period. This way the KPI may be used for any period and as many times as you need. As the dates will be taken from the period, where the KPI Target (based on the KPI) is set.
To compare results for certain periods and see them in a graph, it is recommended to have a more or less strict logic of periods. Usually, KPI targets are set for a whole year and quarterly/monthly intervals. It lets us not only have a KPI overview but also check historical trends.
The app automatically considers various periods that might be compared and shows users a chart of actual values by a specific KPI. To consider periods similar, they should have the same number of days adjusted for a history tolerance.
On the KPI single view interface, сlick on the 'History' button, to see the automatically created graph of the KPI Target for various periods. Below the graph, there is a table, which shows the chosen KPI Target for all the periods, regardless of the number of days in them. Also, you can analyze tendencies by periods on the special 'KPI trends' interface (see KPI History and Trends).

When the end date is already in the Past, it is preferable to close the period to avoid further updates of KPI targets' actual values due to further corrections (it is not a good idea to update December KPIs in the next August even though a sale total needs to be corrected, for example). This action is pretty much the same as when an accountant finishes a fiscal year.
Close periods that have already passed, to avoid further recalculations and lock the values. You can always re-open a period if you closed it by mistake or want to revise something. There are 2 ways to close and re-open a period:
1. From the KPI Scorecard Interface, in the left navigation panel
2. In the tab 'Periods', by choosing a period and clicking 'Close Period'/ 'Re-Open Period'

KPI Periods let you also copy targets from existing periods (so, use them as a template). To that end just push the button 'Substitute targets' and select a period with proper KPI Targets. After that the list with the KPI Target from the chosen period will be created for the current period as well, The KPI formula and KPI Target will remain the same, but calculations will take place already for the current period.
For example, you have 3 KPI Targets (Total Sales - 10000$; Sale Orders Count - 100; Europe Sales Share - 60%) for the first quarter of 2024 - period 'Q1 of 2024'. You create the period, that represents the second quarter of 2024 - 'Q2 of 2024'. As you open the period, you see that it is empty and you need to set KPI Targets. Then, instead of creating each one again for the second quarter, you can substitute targets. Then, the list of KPIs is copied to the current period, and in both periods you see the same list of KPI Targets (Total Sales - 10000$; Sale Orders Count - 100; Europe Sales Share - 60%).
It significantly saves time, since KPI targets usually remain similar for periods of the same length. After that action, you would be still able to change the KPI Target of the current period and calculate the Actual Value for the donor period (of course until you close the period).
To substitute targets:
1. Open the new period in the left navigation panel, to which you want to copy the KPI Targets
2. Choose the period from which you want to copy KPI Targets
3. Click 'Substitute Targets'
4. All KPI Target from the chosen period will be copied to the new period
5. Delete the ones you don't need anymore, by clicking on a cross on the KPI card.
KPI (KPI Formulas)
KPI or KPI formula is an instruction on how to get the required data from Odoo for further calculations. That determines how to count the 'Actual Value' in the KPI Target card. This is the third and final level of the way to get the data from Odoo.
There are the following levels of getting the data from Odoo:
1. Basic Measurements (the core configuration object used for retrieving actual KPI values from Odoo data)
2. Constants (the value that cannot be extracted from Odoo, but you need it for calculations) and Variables (the connected, or specified basic measurements that are required to make a formula)
3. KPI (the formula/instruction for Odoo which defines how to calculate figures based on existing Odoo data and settings)
KPI formulas might combine any number of variables, constants, and other KPIs with mathematical operators. Basic Measurements cannot be used to build a KPI.
The drag-and-drop formula for KPI construction is as simple as it is to write down a mathematical expression: just drag and drop the parts in the right order with the correct operators. Odoo would automatically retrieve data from a database according to a defined parts order for a specified period.
Creating a KPI
To create a KPI formula:
1. Go to the tab KPIs
2. Click 'New'
3. Drag&Drop Operators, Measurements, Other KPI, and Constants to create a formula (see The Interface of the Formula Wizard)
4. Below the Formula wizard, choose the category of the KPI (see KPI Categories)
5. Choose a parent KPI (see KPI Scorecard Interface)
6. Optionally, if you turned on 'KPI Tags' in configuration, assign one or several tags to the KPI (see KPI Tags)
7. Choose a company of the KPI (see Access Rights)
8. Apply the success criteria (The more the better, The less the better) (see KPI Settings)
9. Choose the result type (see KPI Settings)
10. Optionally add result prefix and/or suffix (see KPI Settings)
11. Choose how to round decimals (see KPI Settings)
12. In the tab 'Extra Targets Security' set the access rights for the current KPI formula (see Access Rights)
13. Optionally, add some notes in the tab 'Notes'.
There is a way to see all created KPIs one by one to see their formulas or check the settings. To switch between KPIs quickly:
1. Open any KPI in the tab KPIs
2. Move between KPIs with the help of the back-and-forth arrows
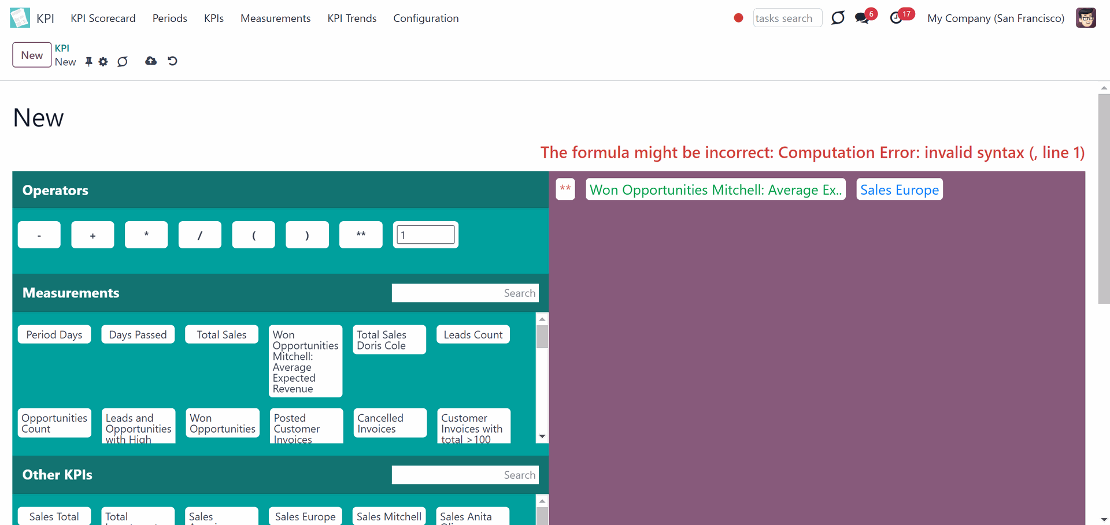
The Interface of the Formula Wizard
The Formula Wizard is the central configuration object, which introduces the tool to construct mathematical expressions in a user-friendly manner through drag and drop. With the help of the convenient interface, you can easily create KPIs and configure them (see KPI Settings).
The interface is divided into two parts: the left part with elements for the formula and the right part, where you create the KPI.
In the left part of the interface you see the following elements, which can be used to create a KPI:
1. Various operators
2. KPI Variables (including the default Variables 'Period Days' and 'Days Passed', that are required for introducing a time frame into the formula) in the tab Measurements (see Measurements (Variables))
3. Other KPIs (the previously created formulas)
4. KPI constants (see Constants)
The section Other KPIs contains previously created formulas, that you can use for creating even more complicated ones. For example, 'Opportunity to sales success ratio' based on KPIs 'Sales count' and 'Opportunities Count')
The formula might be as complex as you require. The available operators are:
1. Subtraction (-)
2. Addition (+)
3. Multiplication (*)
4. Division (/)
5. Opening and closing brackets
6. Exponent (**)
7. Custom float number (write any number in the box to use it in your formula)
Make sure the operators comply with basic Math rules.
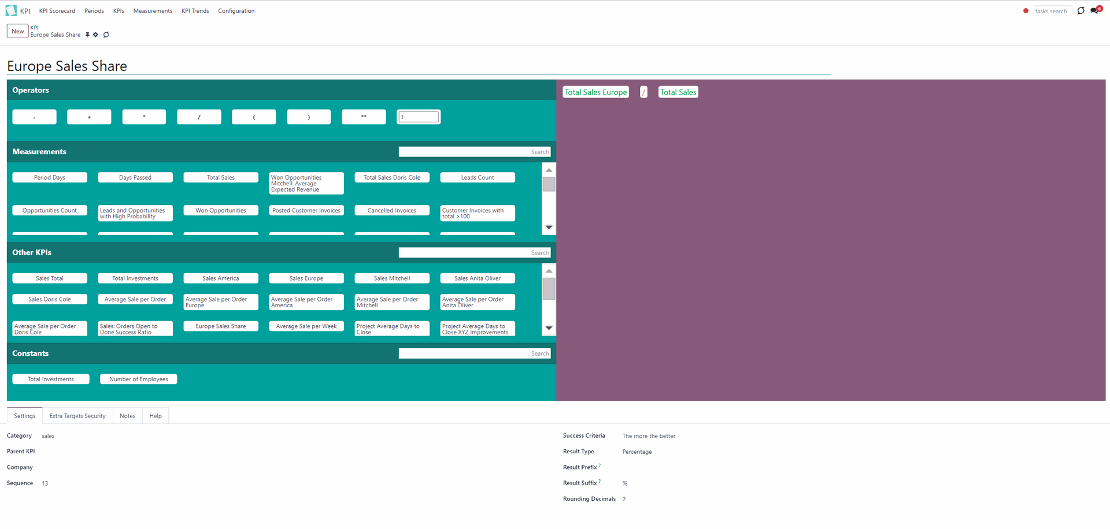
To create a KPI, move elements from the left side of the interface to the right side by Drag&Drop. When elements get to the right side, they change their color according to their type:
1. Operators become red
2. Measurements become green
3. Other KPIs become blue
4. Constants become grey
This way, it is easier to distinguish them in the formula.
In case, there are some critical mistakes in the formula, a warning above it will be shown.
KPI Settings
After creating a formula by Drag&Drop, it is necessary to finish the setup by configuring its settings. The tab 'Settings' is located below the formula wizard.
There you can set:
1. Category (see KPI Categories)
2. Parent KPI (see KPI Scorecard Interface)
3. Tags, if the feature 'KPI Tags' is enabled in configuration (see KPI Tags)
4. Company (if you work in a multi-company environment)
5. Sequence (see KPI Scorecard Interface)
6. Success criteria
7. Result type
8. Result Prefix
9. Result Suffix
10. Currency (for the monetary result type)
11. Rounding decimals

In order, to track the result in the column 'Actual Value' in the KPI Scorecard Interface, which is marked by the color (see KPI Scorecard Interface) you need to choose the success criterion. There are two available success criteria: 'The more the better' and 'The less the better'.
For example, use the criterion 'The more the better', in KPI 'Total sales' or 'The number of sales for 2024'.
For example, use the criterion 'The less the better', in KPI 'Canceled orders' or 'Lost Opportunities'.
Simultaneously, you can choose the result type of the KPI. There are three options: number, percentage, and monetary. Depending on the result types there are some changes in the fields.
To the number and percentage result types, you can add a prefix and suffix to make the results look good. 'Prefix' - is a word or a sign, that will be displayed before the result. 'Suffix' - is a word or a sign, that will be displayed after the result. By default, the percentage result type has the suffix %, which can be changed.
The monetary result type doesn't have fields 'Prefix' and 'Suffix', but it adds the field 'Currency', where one of the used currencies can be chosen.
The module KPI itself doesn't convert currency, so, for the correct calculations, all company transactions should be in one currency. Optionally, you can use the model 'Sales Analysis reports', when you create a basic variable. Then the currencies will be analyzed and calculated into one, which is the default for the company.
Sometimes in some formulas, the result may have a reminder, for example after division. To make the result look better, define rounding rules from 0 to 4 decimal points (1 > 1.2 > 1.23 > 1.235 > 1.2346). After that, only up to 4 numbers after the dot will be shown.
KPI Examples
Here you can find some useful examples, based on our previously created Variables. We can distinguish several kinds of formulas:
1. KPIs, consisting of one Variable. This kind of KPI doesn't require any other operators. The whole formula is one Variable. To create such KPI, you need to simply drag and drop the required Variable to the right side of the interface.
All Variables from the list of examples can be used for creating such KPIs. Just create the corresponding KPI to be able to set a KPI Target.
2. KPIs, consisting of 2 or more Variables. This kind of KPI represents a complex formula, where you add several Variables and some operators.
Here are some examples with previously created Variables:

Use this KPI to see the percent of won opportunities. The number of opportunities on the stage 'Won' is compared with the total number of opportunities.
For example, you have 5 won opportunities and 10 opportunities in total. The set KPI Target was to have at least 70% of the won opportunities. Thus, the result is negative, as there is only 50% of the won ones.
Keep in mind, that to count the result in percent you need to choose the Result Type 'Percentage'. As for the success criteria, in this case, it should be 'The more the better' as we want to won opportunities to prevail.

Use this KPI to see the percent of sales of one of your teams, for example Europe. The total earned by the team Europe is compared with the total earned by the whole company.
For example, the team Europe earned 100$, while the total sales were 1000$. As we have 20 teams, the KPI Target was to earn 5% from the total sales. The team showed a great result and doubled the target. Whether that was the success of the team Europe, or failure of the other teams considers further investigations.
Keep in mind, that to count the result in percent you need to choose the Result Type 'Percentage'. The Success Criteria can be 'The more the better', as the team should show the good results.

Use this KPI to see the amount of money earned per employee. The total earned by the company is compared with the number of employees per company, which was created as a constant.
For example, total sales were 1000$. We have 20 employees, the KPI Target was to earn 40$ per worker. The result is 50$, so the target is reached.
The number of employees might be different for various periods of time. The corresponding configurations, can be made while creating the constant. The constant will be chosen considering the period for which the KPI Target is set (see Constants).
The Result Type for receiving the value in money should be 'Number'. The Success Criteria can be 'The more the better', as the team should show the good results.

Use this KPI to see average amount of money earned per order. The total earned by the company is compared with the number of sale orders.
For example, total sales were 1000$ and we had 50 sale orders, the KPI Target was to have the average receipt for 50$. The result is 50$, so the target is reached.
The Result Type for receiving the value in money should be 'Monetary'. The Success Criteria should be 'The more the better', as the we people to buy more at a time.

Use this KPI to see the amount of money Anita Oliver earned per day. The amount of money that Anita Oliver have earned is compared with the number of days, that Anita Oliver needed to close all her projects.
For example, Anita Oliver had 5 projects per 20 working days. In total she earned a 1000$, so the amount of money, that she have earned per day is 50$. The KPI Target is to earn 60$ per day, so the result is negative and Anita should work faster.
The Result Type for receiving the value in money should be 'Monetary'. The Success Criteria can be 'The more the better', as we want Anita Oliver to earn more money.

Use this KPI to calculate the percent of cancelled invoices. The total number of invoices is compared with the number cancelled invoices.
For example, there were about 50 invoices created. 5 of them were cancelled later. The KPI Target was to have less than 5% cancelled invoices. The result is 10%, so the target is not reached.
The Result Type for receiving the value in money should be 'Percentage'. The Success Criteria should be 'The less the better', as we don't want invoices to be cancelled.

Use this KPI to see the percent of likes for an article with the particular tag. The number of likes per article with the tag is compared with the total number of likes.
For example, total number of likes was 100. The number of likes for articles with the tag 'Odoo' was 40. The KPI Target was to have 50% of likes for articles with the tag. The result is 40%, so the target is not reached. But, here we need to consider also our KPI Target for The Total Number of Likes. Maybe, we have just received much more likes than hoped.
The Result Type should be 'Percent'. The Success Criteria can be 'The more ther better', as we want articles with the tag 'Odoo', to receive praise among readers.
3. Complex KPIs, with Variables of time (Period Days, Days Passed)
Period Days - shows the number of days in a period.
Days Passed - shows the days of the period that have passed for the current day. Unlike the period of days, shows a more accurate result at the beginning of the period. When using Period Days, at the beginning of the month the results may be drastic, as there wasn't enough time to show good results.
For example, you set the KPI Target to see Total Sales per Period. Let's say you want to earn a1000$ per month (1.09 - 30.09). Now it is the 3rd of September and the company earned 200$ by now.
If you use the KPI Formula Total Sales / Period Days, then 200 will be divided by 30 (the total number of days in the period) and therefore the result will be negative and will not reflect reality. As 200& per 3 days is a good result compared to our target (1000$).
If you use the KPI Formula Total Sales / Days Passed, then 200 will be divided by 3 (days passed by now) and the result will be marked as positive. As the calculations take place every day, the next day the module will already divide the Total Sales by 4, then by 5, and so on. So, the result will be always acute.

Use this KPI to see the average profit for a week. The total earned on sales is divided by the passed time (in weeks).
For example, for the month we have earned a 1000$. Thus, 4 weeks have passed. The KPI Target was to earn 200$ per week. The result is 250$, so the target is reached.
The Result Type should be 'Monetary'. The Success Criteria can be 'The more ther better', as we would rather earn more per week.

Use this KPI to see the average profit for a day. The total earned on sales is divided by the days passed.
For example, today it is the 20th of September and by now we have earned a 1000$. The KPI Target was to earn 50$ per day. The result is 50$, so the target is reached. But we still have 10 more days till the end of September, so we should keep up with it.
The Result Type should be 'Monetary'. The Success Criteria can be 'The more the better', as we would rather earn more per day.
KPI Categories
A KPI Category – is KPIs storage, which is used for convenient navigation over KPIs and managing access rights to them. To control KPIs related to specific areas combine them into corresponding categories. For example, to check targets only in sales (category 'sales') or targets of a specific sales team (category 'sales > sales team Europe').
Each KPI should be assigned to a single category, in order to find required targets quickly just by checking the boxes on the scorecard interface.
Categories support hierarchy. A category may have a parent and sub-categories.
To create a category:
1. Go to Configuration > Categories
2. Click 'New'
3. Type the category's name
4. Choose the parent category, if any
5. In multi-company mode, choose the company
6. If you want some users or user groups to have access to see the category and its KPI Targets, state them in the 'Read Rights' section (see Access Rights)
7. If you want some users or user groups to have access to edit the KPI Targets of a category, state them in the 'Edit Rights' section (see Access Rights)
8. Optionally, add some notes in the tab 'Notes'.
Move the categories in the list (Configuration > Categories) by drag and drop to change their sequence. This will help to keep a particular order in the left navigation panel of the KPI Scorecard Interface. Keep in mind, that the order of sub-categories will not affect the order of the parent categories. Therefore sub-categories will always follow their parent category.
If you have a lot of categories and sub-categories, then you may find it difficult to navigate through them and select the ones you need quickly. Thus, for extra convenience, a special search bar above the categories list in the single-view interface was introduced. Just start typing the word and click 'Enter' or the search button and the matching results will be shown and marked red. Click the button 'Reset' on the right side of the search bar to empty the search.
KPI Tags
With the help of tags, you can structure KPIs, for the convenient management of the related KPI Targets. This way, you can create your own classification of KPIs, which reflects the specifics of the business. For example, create tags according to the sphere of the related KPIs, related users, or importance.
To create and manage KPI Tags the option 'KPI Tags' in the module's settings should be enabled. After that, the tree of tags will appear in the KPI Scorecard Interface and the separate KPI Tags menu will appear.
There are two ways to create tags: through the separate menu or by typing the tag's name in the field 'Tags' and clicking the button 'create' as you create or edit a KPI Formula.
Tags support hierarchy. A tag may have a parent and sub-tags.
To create a tag through the separate menu:
1. Go to Configuration > KPI Tags
2. Click 'New'
3. Type the tag's name
4. Choose the parent tag, if any
5. In multi-company mode, choose the company
6. Optionally, add some notes in the tab 'Notes'.
You can assign tags to a KPI, in the field KPI Tags. A single KPI might have an unlimited number of tags assigned.
If you have a lot of tags and sub-tags, then you may find it difficult to navigate through them and select the ones you need quickly. Thus, for extra convenience, a special search bar above the tags list in the single-view interface was introduced. Just start typing the word and click 'Enter' or the search button and the matching results will be shown and marked red. Click the button 'Reset' on the right side of the search bar to empty the search.
KPI Scorecard Interface
The next step, after creating one or several KPIs is – setting a KPI Target. Setting a KPI Target implies setting a goal. For example: to earn 50000 for the first quarter of 2024. Setting a KPI Target helps to track the company's progress in reaching that goal, and take preventive measures if there is a negative tendency in the current results.
The KPI Target is set for a particular period. In the main module interface, you can switch between all created periods to see the list of set KPI Targets for each.
Manage KPI Targets by updating the target values, if necessary.
Set the KPI Target once and use those multiple times for different periods to avoid double work with the help of the function 'Substitute Targets'.
Compare the Actual Result of the same targets for similar periods on a graph, to make future KPI Targets more reasonable.
KPI Targets
KPI Target is the key element in evaluating the result of a company's, its teams, or an employee's work. KPI Target is your plan for a particular KPI for a given period. By setting up a target value, you indicate, which result, you would like to achieve by the end of the period and track the actual result to detect flaws.
To set a target:
1. Click on the button 'Set Target'
2. Choose the KPI formula
3. Type the target value
4. Click 'Save&Close'.
The KPI Target is created for the period, that is chosen in the left navigation panel.
As you set the KPI Target, it appears in the target list in the main panel. Each KPI Target card includes the title, actual value, target value, and actions panel.
Actual value lets you track the current progress toward fulfilling the target's value. Depending on the chosen 'Success Criteria' (the more the better or the less the better) the Actual Value is analyzed according to the target value and the result is marked by the color (see KPI formulas).
If the actual value is red, then it shows a negative result. The green actual value shows a positive result. If you added some notes to a KPI, then as you hover over the linked KPI Target the note will appear.
A grey KPI Target with an exclamatory mark and 'N/A' in the field 'Actual value' shows that either there is not enough data for calculation or there is a mistake in the formula. Hover over the exclamatory mark to see the error type.

The KPI interface displays a progress bar column, which counts percent completion for positive goals and positive actual values. It works differently for different success criteria (The more the better, The less the better).
If the success criteria 'The more the better is chosen', then the shown colors have the following meaning:
1. Red - the KPI Target is under-fulfilled
2. Green - the KPI Target is fulfilled
3. Green with stripes - the KPI Target is over-fulfilled
If the success criteria 'The less the better is chosen', then the shown colors have the following meaning:
1. Red - the Actual Value is overspent
2. Green - the Actual Value is within the KPI Target
3. Green with stripes - the Actual Value is lower than the KPI Target and, can be further raised
In case, the percentage has got over 100, it is still shown graphically up to 200, while the width of 1% in each row remains the same.

On the right side of a KPI Target's card, there are some buttons, that you can click:
1. Change Target
2. See the history
3. Delete Target
To change the Target, click on the 'Change Target' icon on the right side of the KPI Target. In the pop-up window, you will be able to switch between available KPIs and type manually the target value.
If you have enough data and several same KPIs for different periods you can see the KPI history. To see the history of KPI by periods click on the 'History' icon. In the pop-up window, you will see a diagram of 'History by similar periods'. The app automatically considers various periods that might be compared to this one, and shows users a chart of actual values by a specific KPI (see KPI History and Trends).
To Delete the Target, click on the 'Cross' icon on the right side of the KPI Target. In the pop-up window, you will be asked to confirm the decision.

The KPI Target's list is formed according to the hierarchy. Hierarchy allows highlighting targets with indicative padding for an instant overview of sub-KPI Targets.
The Hierarchy is set according to:
1. KPIs sequence
2. Parent/child relations
To change the sequence of KPIs, move them in the tab KPIs by drag&drop or open any KPI and type the number in the field 'Sequence'. To be on top, the sequence should be smaller.
KPI's relations are more important than the sequence, so the parent KPI will always be higher, than its sub-KPIs. And the sub-KPIs will not be divided by other KPIs, no matter what their sequence is.
You can set the parent KPI below the Formula wizard as you create or edit KPI (see KPI (KPI Formulas)).
All the calculations in the KPI module are made due to the system schedule, once or twice per day. So, as you set the KPI Target you don't see the current result right away. But, you can also trigger the calculation manually by clicking 'Calculate' in the KPI Scorecard interface.
After setting a Target, keep in mind, that calculations take place according to the system schedule. To avoid waiting and see the 'Actual Value' right away - click 'Calculate'.

You can change the frequency of the automatic KPI calculation. For that:
1. Go to Configuration > Settings
2. Click 'Configure Cron Job'
3. In the field 'Execute every' choose the number and type of period the actual KPI should be recalculated
4. Click 'Save'.
The module supports the export of KPIs. The KPIs are exported and imported in the .xlsx format.
To export KPIs:
1. Click on the button 'Export KPI' in the KPI Scorecard Interface
2. The downloading will start automatically
The KPIs are exported for a particular period, which is chosen in the left navigation panel. The following fields are exported: KPI, KPI Target, Actual Value, and Notes. The exported KPIs save the order and are structured according to the hierarchy. The file itself is named after the period that it represents.
KPI Periods
The displayed KPI Targets list belongs to the period, which is chosen in the left navigation panel. Switching between periods allows you to see all KPI Targets that belong to a particular period. To switch between periods click on the dates line and choose the period for which you want to see the KPI Targets.
When the end date is already in the Past, it is preferable to close the period to avoid further updates of KPI targets' actual values due to further corrections (it is not a good idea to update December KPIs in the next August even though a sale total needs to be corrected, for example). This action is pretty much the same as when an accountant finishes a fiscal year.
Close periods that have already passed, to avoid further recalculations and lock the values. You can always re-open a period if you closed it by mistake or want to revise something. There are 2 ways to close and re-open a period:
1. From the KPI Scorecard Interface, in the left navigation panel
2. In the tab 'Periods', by choosing a period and clicking 'Close Period'/ 'Re-Open Period'
Periods are important for the calculation of Actual Value. Only objects within the period dates are considered for the calculation according to the chosen Date Fields for a Basic Measurement. For example:
1. You created a Basic Measurement 'Done Sale Orders: Total'
2. In the 'Date fields' choose 'Order Date'
3. Connected a Variable 'Done Sale Orders: Total', so it appeared in the formula (as Basic Measurements can't be used directly for formulas)
4. Created a period 'Year 2024' and stated its dates
5. Created a formula and set a KPI Target for the period 'Year 2024'
6. Only Sale Orders, which have been created in 2024, will be considered for calculations of Actual Value
This way, when the dates are not used in measurement or KPI - there is no need to rewrite them for each period. You can use the button 'Substitute Targets' to copy KPI Targets from one period to another. It significantly saves time, since KPI targets usually remain similar for periods of the same length. After that action, you would be still able to change the actual scorecard for this period (of course until a period is closed) (see KPI Periods).
To substitute targets:
1. Open the new period in the left navigation panel, to which you want to copy the KPI Target, and click 'Substitute Targets'.
2. In the pop-up window, choose the period from which you want to copy KPI Targets
3. Click 'Substitute Targets'
4. All KPI Target from the chosen period will be copied to the new period
5. Delete the ones you don't need anymore, by clicking on a cross on the KPI card.

To track the fulfillment progress and changes in achieving the KPIs, use the 'History' button on the right side from a KPI Target in the KPI Scorecard Interface. It allows comparing the KPI Targets and Actual Values by similar periods. To be considered, the periods should have the same number of days adjusted for a history tolerance (see KPI History and Trends).
Navigation
There are several ways to navigate among the KPI Targets:
1. By the category
2. By tags, if the feature 'KPI Tags' is enabled in the configuration
3. By the search bar
4. By referring, to the previously saved search parameters
KPI Categories is a great tool, which allows storing connected KPI Targets and browsing between them quickly. Categories also allow managing access to the KPI Targets in a batch (see Access Rights).
Tick a category to see all its KPIs. If you choose a parent category, you will see all KPIs of its subcategories as well. To reset the choice click on the icon '' by the word 'Categories' (see KPI Categories).
If you have a lot of categories and sub-categories, then you may find it difficult to navigate through them and select the ones you need quickly. Thus, for extra convenience, a special search bar above the categories list was introduced. Just start typing the word and click 'Enter' or the search button and the matching results will be shown and marked red. Click the button 'Reset' on the right side of the search bar to empty the search.
Simultaneously, you can use the search bar above the main part of the interface to find the KPI Targets by the connected KPI. Just start typing the KPI's title and click 'Enter'. To reset the search click on the cross by it.
Create any classification of KPIs with the help of tags. For example, create user-related tags or tags to mark the importance of certain KPIs. Make sure, that the option 'KPI Tags' is enabled on the configuration page.
Tick a tag to see all its KPIs. If you choose a parent tag, you will see all KPIs of its sub-tags as well. To reset the choice click on the icon '' by the word 'Tags' (see KPI Tags).
If you have a lot of tags and sub-tags, then you may find it difficult to navigate through them and select the ones you need quickly. Thus, for extra convenience, a special search bar above the tags list was introduced. Just start typing the word and click 'Enter' or the search button and the matching results will be shown and marked red. Click the button 'Reset' on the right side of the search bar to empty the search.
It is possible to save search parameters, to access the search result quickly. For that:
1. Apply one or several search parameters
2. Click 'Favorites'
3. Choose 'Save current search'
4. Type the search name
5. Tick 'Use by default', if you want to see the KPIs this way as you open the app, OR tick 'Share with all users' if you want other people to be able to see and apply these search parameters
6. Click 'Save'.
After that, you will be able to switch to this search quickly by clicking 'Favorites' and choosing it.
KPI History and Trends
The module tracks the history of set KPI Targets and related Actual Values by periods. To compare results for a certain time and see them in a graph, it is recommended to have more or less strict logic of periods. The app automatically considers various periods that might be compared and shows users a chart of actual values by a specific KPI. To consider periods similar, they should have the same number of days adjusted for a history tolerance.
For example, you have 2 KPI Targets 'Total Sales' and 'Sales Count'. The first KPI Target is set for each quarter of 2024 and the year 2024. The second KPI Target was set twice for a monthly period, once for the year 2024 and once for the first quarter of 2024. The KPI Target 'Total Sales' will have an automatic graph generated by the quarters (featuring those, that have already begun or passed), as the periods are rather similar. As for the KPI Target 'Sales Count', it will be impossible to generate a corresponding graph, but still, we will be able to see the table below it with the results for all available periods.
Sometimes the length of periods cannot be precise, for example, in February there are 28/29 days. So, you can instruct the module on which periods should be considered similar by defining the tolerance on the configuration page.
To set the tolerance go to Configuration > Settings and find the field 'History Tolerance'. Type the difference (number of days), that periods can have to be considered similar. For example, 7-day periods might be compared to 5-day and 9-day periods. Then, tolerance would be 2.
It is necessary to have at least a 2-day tolerance to compare quarterly periods (since a quarter might take from 90 to 92 days), and a 3-day tolerance for months (as February may last 28 days).
In the KPI Scorecard Interface, click on the 'History' button, to see the automatically created graph of the KPI Target for the related period. Switch between bar and line graphs to conveniently analyze the results. By default, the line graph is shown.
On the graph, you will see the set KPI Target and the Actual Value for the related period. Both the goal and the actual value can be hidden from the chart. Just click on the related label above the graph. Click one more time, to make it visible on the graph again.
The progress of the KPI completion is expressed by the color scheme.
On the line graph, red color shows that the KPI Target is not completed, light green color that the target is over-fulfilled, and dark green color that the KPI Target is planned and fulfilled.
On the bar graph, the KPI Target is always green and the Actual Value can be red (the goal is unfulfilled); or green (the goal is completed).
Below the graph, there is a table, which shows the chosen KPI Target for all the periods, regardless of the number of days in them.

KPI Managers can also see the statistics of the KPI fulfillment in the KPI trends interface. The related button can be found in the systray as you open the KPI app. KPI Trends contain a list of all history charts/graphs for all KPIs, which have KPI Targets set.
Depending on the existing periods, Odoo will calculate the available period types according to the specified tolerance parameter. This way goals will be shown by duration, f.e. Quarterly and yearly goals. To see the statistics for all available period types, choose the option 'All period types'.
In case you work in a multi-company environment and have access to several companies, you can switch between them to see the related KPIs.
For all charts, you can switch between the line/bar view. Just choose the type of view in the left functional interface.
For all charts at once, you can hide KPI Targets/Actual Values. To show hide KPI Targets, click the slider button 'Show Targets'. To show hide KPI Targets, click the slider button 'Show Targets'.
You can filter KPIs by category, for that, just tick the category/categories in the left functional interface. If you choose a parent category, you will see all KPIs of its subcategories as well. To reset the choice click on the icon '' by the word 'Categories'.
If you have a lot of categories and sub-categories, then you may find it difficult to navigate through them and select the ones you need quickly. Thus, for extra convenience, a special search bar above the categories list was introduced. Just start typing the word and click 'Enter' or the search button and the matching results will be shown and marked red. Click the button 'Reset' on the right side of the search bar to empty the search.
If the option 'KPI Tags' is enabled, you can also filter KPIs by tags. For that, just tick the tag/tags in the left functional interface. If you choose a parent tag, you will see all KPIs of its sub-tags as well. To reset the choice click on the icon '' by the word 'Tags'. Optionally, use the tags searchbar above to find the ones you need quickly.
The list of available charts will be seen in the main interface. Above you will see the Reference of the KPI, the '' icon button, that allows expanding the graph on the whole screen and hiding it back, and the buttons to switch between the line and bar graphs.
You can show/hide KPI Targets/Actual Values of a particular graph. For that, just click on the related label above the graph. Click one more time, to make it visible on the graph again.
Scroll down to see all available history graphs or use the KPI filters, which are organized hierarchically in the left functional panel, to find the related KPI Targets quickly. For that, just tick one of the KPIs. If you choose a parent KPI, you will see all included KPIs as well. To reset the choice click on the icon '' by the word 'KPIs'.
Above the KPIs filters in the left functional panel, you will also find a search bar to find the required ones quickly. Just start typing the word and click 'Enter' or the search button and the matching results will be shown and marked red. Click the button 'Reset' on the right side of the search bar to empty the search.
Access rights
Rights to administrate KPI belong to 2 user roles: 'KPI User' and KPI Manager'. If the internal user doesn't have one of the KPI roles assigned, the related menu will be hidden for such a user.
Simple KPI users see only the KPI Targets to which they have rights. They can set targets for available to them KPIs and can edit targets based on the KPIs, that they have the right to edit.
Access to all KPIs and the linked targets is available only for users with the right 'KPI Manager'. KPI managers would have full rights for all KPIs disregarding the settings, while other users would have rights only to KPIs which settings (or category settings) allow them so.
KPI managers would have full rights for all KPIs disregarding the settings.
Rights to see or edit KPIs are managed on two levels: for a single KPI (on the form view, below the formula wizard) and for the whole category. KPI category rights and KPI own rights are combined.
There are two types of access rights: 'Read Rights' and 'Edit Rights'. 'Read Rights' lets users only observe shared KPIs. 'Edit Rights' would also allow setting and changing targets. The latter might be useful in case you ask your manager to manage goals within a department.
To give access to a particular KPI to a user or a user group:
1. Go to the tab KPIs and start creating or editing a KPI
2. Scroll down and open the tab 'Extra target security'
3. Choose users or a whole users group, that will be able to see only or edit the KPI
You can also administrate user accesses in a batch, by configuring access rights to a whole category. State people, who can read it, or edit it as you edit a KPI's category. A person or user group that has a certain right to a category, doesn't have access to its subcategories.
For example, you might want to share tasks' targets with related project users to allow them to control their fulfillment themselves. Edit rights assume sharing access to set specific targets up. For instance, you may find it a good idea to involve the sales manager in setting sub-targets for their sales team.
To give access to a particular category:
1. Go to Configuration > Categories
2. Start creating or editing a category
3. If you want some users or user groups to have access to see the category and its KPI Targets, state them in the 'Read Rights' section
4. If you want some users or user groups to have access to edit the KPI Targets of a category, state them in the 'Edit Rights' section.

By default, KPIs and the linked targets are available only for users with the right 'KPI Manager'. KPI managers would have full rights for all KPIs disregarding the settings, while other users would have rights only to KPIs which settings (or category settings) allow them so.
To assign a KPI Manager:
1. Go to Settings > Manage Users
2. Choose a particular user
3. Scroll to the section 'Productivity'
4. In the field 'KPI Management' choose the option 'KPI Manager'
Multi-Company Environment
The module supports the multi-company environment. So, if you have several companies in your Odoo environment, then you face the following peculiarities:
1. The 'Company Field' should be chosen, when a Basic measurement is created. So, when you create a Variable to calculate something within a particular company and choose the company - the module will know where to find the information
2. Basic measurements and Categories are general and seen by all companies
3. Variables, Constants, and KPIs can be either mutual (available for both companies), or company-related (only the related company will see those)
4. KPI Targets and Periods are seen only within the company, where they were created (even the general ones, which refer to the parent company)
5. The KPI Manager may only manage those KPI Targets, that refer to the manager's company. If the KPI Manager has access to several companies within the platform, then, it is possible to switch between them in the top right corner
6. Users that relate to one company, but who are given rights to KPIs or KPI Categories of another company, to which they have no access - will not be able to see such KPIs.
Configuration Page
The module has a configuration page, where you can make necessary changes to make your work convenient.
History Tolerance: define how to distinguish similar periods. For example, 7-day periods might be compared to 5-day and 9-day periods. Then, tolerance should be 2. If you have monthly or quarterly periods, you should have at least a 3-day tolerance (see KPI History and Trends).
Configure Cron Job: configure when and how frequently KPIs' actual values should be re-calculated (see KPI Targets).
KPI tags: turn on to structure KPIs by tags (see KPI Tags).
Show Help: add a special tab 'Help' to KPI objects, to get the information about those handy. For example, if enabled, you can find a 'Help' tab as you create or edit a 'Basic Measurement' with information about this type of measurement and its calculation types and settings.

About KPI Balanced Scorecard
KPI Balanced Scorecard is an Odoo app, which allows users to set up KPI targets and control their fulfillment by periods. The app introduces a convenient KPI dashboard to manage companies and personal targets. It helps to organize work as a set of periodic goals and to control those goals in any business or functional area. For that purpose:
- The app introduces a clear system to get Odoo storable details: a count of records, a sum or an average of numeric fields, or even pure Python code.
- Actual values are re-calculated by the special Odoo cron job. So, it is always possible to understand which KPIs require more attention in real time at first glance.
- You can share KPI targets with interested users to organize a transparent dashboard of goals: from global to particular ones.
- It is possible to consider only those KPIs that are of interest: for example, only sales-related or of a definite user. Hierarchy allows highlighting targets with indicative padding for an instant overview of sub-KPIs.
- Help hints are available for most objects to simplify KPIs setup (turn on/off help tabs through the app configuration page)
- The module supports the multi-company environment, and, therefore all KPI calculations and settings are configured for each company separately.
Set KPI Targets by periods
Drag and Drop interface for KPI formulas
Use any Odoo data to calculate KPIs
Auto and regularly updated KPIs
Concepts and terms
Here you can find all the terms that were used in the documentation.
KPI (KPI Formula, Key Performance Indicator) - the formula/instruction for Odoo that defines the way to calculate figures based on existing Odoo data and settings. This central configuration object introduces the tool to construct mathematical expressions in a user-friendly manner through drag and drop. These are the examples of KPI: Total Sales in Europe, Done Tasks per Day of John Brown.
A KPI Period - a time frame for which companies set their targets to control performance (in a similar way as financial performance is controlled within accounting/fiscal periods). You can set periods of any length and for any date, usually some yearly (2024, 2023), quarterly (Q1 2024, Q2 2024), monthly (Jan 2024, Feb 2024) approach is applied. KPI Targets are calculated for each specific period.
KPI Target - actual company goal based on specific KPI and KPI period. It allows setting a planned KPI value, so it will automatically calculate a real value based on Odoo data and the KPI formula for this KPI period. KPI targets are set regularly for each analytic period by responsible managers and might be shared among interested users to control results continuously. These are the examples of KPI Targets: Total Sales in Europe in 2024 (target: $1,000,000; actual: $800,000); Done Tasks per Day by John Brown in July 2024 (target: 1,5; actual: 2).
Basic measurement - the core configuration object used for retrieving actual KPI values from Odoo data. Although basic measurements are not used for formula constructions, they are required to prepare any sort of formula variables. These are the examples of basic measurements: Aggregated Sum by Done Sales Orders (the period is defined according to a sale order date); The Total Number of Tasks in the State ‘done’ (the period is defined according to the last stage update date).
Python code measurement – a specific type of Basic measurement, which requires technical knowledge and allows the creation of instructions for the module on how to get the data from Odoo.
Measurements (Variables) - a specification of a basic measurement. The key idea of distinguishing KPI Variables from Basic measurements is to simplify data preparation. You define 'Total Sales' once, and then unlimitedly use it for 'Sales Europe', 'Sales John Brown', 'Website Sales', etc. Measurements are used to prepare KPI formulas (available for drag and drop).
Constant - the special type of KPI Variables used when data can not be retrieved from modules and/or when figures remain the same during the whole period. For example, 'Total Investments' or 'Number of Employees' are often frozen for a specific period. Constants are used to prepare KPI formulas (available for drag and drop).
KPI Scorecard - the special interface to configure and control targets, which are shown according to a chosen period. The interface allows you to choose, close, and re-open periods; set, substitute, and filter KPI Targets; see KPI History.
A KPI Category - KPIs storage, which is used for convenient navigation over KPIs and managing access rights to them. To control KPIs related to specific areas combine them into corresponding categories. For example, 'Sales KPIs' and 'Team Europe KPIs'.
A KPI Tag - is a special object to structure KPI targets, used for convenient management and search.
KPI History – the special interface of a specific KPI target to control its KPI values by all periods, including a graph of similar periods.
Closing KPI period – the special action to stop KPI re-calculations and finalize the period results (can be compared with closing a fiscal year).
KPI User - any internal user, that has access either to see or edit one or several KPIs or KPI Categories.
KPI Manager - the assigned user or users, that have full rights for all KPIs disregarding the settings.
The difference between KPI and KPI Target
Two important concepts are used in the module: KPI and KPI Target. They have significant differences.
KPI or Key Performance Indicator is a formula, that represents a measurable value that demonstrates how effectively a company is achieving key business objectives. It is used to evaluate the success of reaching a company's goals. It may focus on the overall performance of the business, of some smaller departments (sales, appointments, HR...), or even particular employees.
The company's performance based on a particular formula is stated in the Single View Interface in the column 'Actual Value' (see Single View Interface).
A KPI Target is a goal, a particular number/amount. It has guidelines and requires a formula to be calculated. Therefore we can imagine it as Formula (KPI) + Period.
In the Single View Interface, KPI Targets are stated in the column 'Target Value'(see Single View Interface).
KPI Target is put manually, by the responsible for that person. To be valid, the goal should be SMART. The letter in the abbreviation SMART stands for:
1) Specific (related to a particular Odoo model)
2) Measurable (see Measurements)
3) Achievable (possible to fulfill)
4) Relevant (acute for the company development)
5) Time-specific (see Periods).
KPIs (key performance indicators) - are measurements that aim to evaluate the organizational or personal success of a definite activity. Different companies have different KPIs depending on their strategy and business area. However, all KPIs have a common core attribute: they must be measurable within a target period. To that end, KPIs allow the construction of formulas to retrieve Odoo data sets and process those into real figures. Formula preparation is as simple as it is to write down a mathematical expression: just drag and drop formula parts in the right order with correct operators. KPIs, KPI periods, and KPI targets KPIs represent the list of success figures you may use to plan your company activities. Simultaneously, measurements are almost senseless unless you have target values for those KPIs. That is possible only within a time-constrained period. 'Sell as much as you can' is not a goal, while 'Generate 100,000 Euro Revenue in the year 2024' is a good aim for a salesperson, for example. To that end, KPI periods are introduced.
A combination of a KPI and a KPI period results in a KPI target. Exactly with those targets you work on the scorecard interface. For each KPI you would like to manage in this period, you should define a planned value to compare those to the actual at the end of the period.
So, a KPI itself defines how to compute the actual value for a period and how to estimate the result ('the more the better' or 'the less the better'), but does not assume setting targets. The latter should be done for each period.
Basic Measurements
Basic measurement is the core object used for retrieving actual KPI values from Odoo data. Although Basic measurements are not used themselves for formula constructions, they are required to prepare any sort of Variables.
A Basic measurement represents the most general instructions for the module to find the data, while Variables specify those. For example, 'Total Number of Sale Orders' should be a Basic measurement, while a narrower 'Number of Quotations of the Sales Team Europe' is recommended to be a precision of that basic measurement - Variable. Each Basic measurement might have an unlimited number of linked Measurements (Variables).
By default, the KPI module contains some Basic measurements, which you can use to create Variables.
To create a Basic measurement:
1. Go to Measurements > Basic Measurement
2. Click 'New'
3. Type a name and optionally add a model type before it (for example [purchase]) to find the measurement quickly
4. Choose a KPI Type, to activate a set of further fields and define the way the module will get the information for calculations (for example, the records can be counted or the value of particular record fields will be counted)
5. Chose a Model, an Odoo object from which the data will be taken (for example, Sale Orders, Purchases, Quotations)
6. Based on the KPI Type you will see a set of other fields
7. Add a 'Measure field' for the analysis (the fields from which the module will take the data to count, to calculate the sum of records or count the average value of the fields (Only for types: 'Sum of records field', 'Average of records field')
8. Add one or several date fields (those are fields, that will be taken into consideration in the calculations when the period is stated, for example, order date or delivery date). If you choose several fields, then, for the record to be considered for calculations, both of those fields should be within the period
9. Add a company field for the analysis, if you work in a multi-company environment (for example, if you have 2 or more companies, you may want to calculate KPI for each of them, so for the app to be able to distinguish companies, the field should be added as you create a Basic measurement)
10. It is possible to add some filters, but it is recommended to add only basic ones and then, specify them while creating a Measurement (Variable) (thus, your Basic measurement will be more general and so, you will have more possibilities for creating a Variable. For example, you created a Basic measurement 'Sales Total', which you can use to create Variables: Sales Total Team America, Sales Total Team Europe, Sales Total John White...)
The first field 'KPI Type' defines how Odoo data should be calculated:
1) Choose the KPI Type 'Count of records', if you want to count all matching records, for example, the number of registered leads or the number of posted customer invoices
2) Choose the KPI Type 'Sum of records field', if you want to sum up a certain number field of records, for example, the sum of the total amount of all orders or the sum of paid taxes by invoices
3) Choose the KPI Type 'Average of records field' to get the average of record's number fields, for example, average planned hours per task or average days to assign a lead
4) Choose the KPI Type 'Executing Python code' to compute any sort of figures based on any Odoo data. This type requires technical knowledge (see Executing Python code)
The second field 'Model' defines an object, from which the information is taken. It assumes that you define how records should be searched and which record fields should be used for computations. For example, 'Sales Order', 'Task', 'Lead/Opportunity'. You can also rely on standard or custom objects (including those created in the Odoo studio)
The third field 'Measure field' is required only for the calculation of the KPI types 'Average' and 'Sum'. It defines which figure you use for calculations. For example, 'total amount' of Sales Analysis Report or 'work hours of tasks'. It is a 'Column' in the database table related to the model above.
Depending on the model that you choose, the list of fields varies. For example, the model - 'Articles' has such measure fields as likes or dislikes number, referred to in emails; and the model - 'Sale Order' has such fields as total, delivery orders, and invoice count.
The fourth field 'Date fields' is required to understand whether a specific document type relates to a considered period, so, how to distribute objects by time intervals. It assumes that you define how records should be searched and which record fields should be used for computations.
Each model has its list of available date fields. The object's fields, which contain information about time can be chosen. For example, for tasks, you might use the create date to analyze jobs registered within this KPI period (e.g. 'Total number of tasks created in January 2024'), order date for a sale order, revision date for an article, and reserved time for an appointment.
For example, you create a Basic measurement 'Total Sales' for the model 'Sales Order'. In the field 'Date Fields' you choose 'order date'. Then, after creating the corresponding Variable and KPI Formula, you set a KPI Target to receive 100000$ for the Period 'The Year 2024'. The module will get the instructions, to consider only the sale orders, which were created during this particular period. Those sale orders, within the period, will be used for calculations of the actual value.
It is also possible to apply a few date fields, so matching to ALL of those date objects will be considered(e.g. 'Opportunities opened and won in January 2024').
If date fields are not specified, the calculation will consider all records for all times regardless of the period. For example, you created the Basic measurement 'Total Sales' and left the date field empty. After setting the KPI Target, the module won't get any instructions on how to filter objects by dates, or where to get the information about the date. That means the KPI Period would not influence this Basic measurement. Therefore, all existing sale orders disregarding the period will be used for calculations.
The fifth field 'Company Field' would be needed for a multi-company environment. This field gives instructions to the module, where to search for the related to a company model.
Even after choosing this field on the Basic measurement level, you can create a global Variable, that will count the result disregarding the company. For that, leave the field 'Company' empty.
For example, you create a Variable 'Total Sales Chicago' based on the Basic measurement 'Total Sales' and in the field 'Company' choose the Company Chicago. If you didn't choose the field, from which the module will decide to which company an object relates (while creating the Basic measurement), then as you set the KPI Target, you still will see the global result - the total sales of all teams.
The section 'Filters' shows you records, which relate to the chosen module and will be used for getting the value for calculations. 'Filters' also allow you to restrict records set by any stored field. For example, you may calculate the count of only won opportunities based on stage settings or only posted customer invoices based on journal entry type and state.
Let's add some filters to create a Basic measurement 'Posted Customer Invoice'. In this case, we need to filter records by type and status. The first filter is 'Move Type = Customer Invoice', and the second one is 'Invoice Status = Open'. Above the filtering options, we can choose, whether the records should match ALL or ANY of our filters. As we chose ALL, only records, which correspond to both move type and invoice status will be considered for further calculations. Click on the button 'N records' to see all the matching invoices.
It is recommended to use 'Filters' for low-level filtering in Basic measurements and then specify them in KPI Variables. This way, you avoid double work and create more Variables based on one Basic measurement.
Also, avoid adding dates to the filtering options, as then you will be required to change dates every time you create a KPI Target for a new Period. If you don't add dates' restrictions as a filter, you will be able to simply 'Substitute Targets' and records will be analyzed based on the fields chosen in the fourth field 'Date Fields' (For example, 'Create Date') (see KPI Scorecard).
Executing Python code
'Python code' is a special type of basic measurement. This type requires technical knowledge but lets you compute any sort of figures based on any Odoo data without restrictions. Such measurement might be any Python basic script with the possibility of SQL queries (through using 'env.cr') In calculations you may rely upon the special variables: 'period_start' (the first date of the period), 'period_end' (the last date of the period), 'period_company_id' - res.company object for which Odoo makes calculations at the moment (according to a KPI period under consideration) Correct Python code assumes saving the value into the special variable 'result'.
Basic measurements of the type 'Execute Python code' can't be any more specified, since they do not relate to any records. However, such measurements should have a single KPI variable linked.
Basic Measurements Examples
Based on one Basic Measurement you can create multiple Variables to use in different KPIs (see Measurements (Variables)). Here are some Basic Measurement Examples, that you can create:
The Purpose of the Basic Measurement is to count all Leads and Opportunities. This way you can find out the exact number of all Leads and Opportunities that your salespeople processed.
The Basic Measurement that sums the total value of All done Sale Orders. Choose the 'Measure field' - 'Total', so the module will sum the value from it. In order to consider only 'done' orders, add 2 Filters: Status = Sales Order; Status = Sales Done. Make sure that records should match Any of those filters. This way you can find out how much did the company earned on sales.
The Purpose of the Basic Measurement is to count all posted customer invoices. In the field Filters, choose: Type = Customer Invoice and Status = Posted. This way you will know how good the sales process goes.
The Basic Measurement that sums the total value of All Purchases. Choose the 'Measure field' - 'Total', so the module will sum the value from it. This way you will know how much money was spent on the vendors products for a particular period of time.
Count all the products types in stock. This way you can find out how many product types are available for sale.
The Basic Measurement to count for what number of days all tasks were completed. This way you can find out how much time your workers needed to finish their work.
When the time of the appointment isn't set and can vary, create this Basic Measurement to track the Average time of an appointment. For example, what is the average time, that users book to rent a car. This way you can find out what services require more time and therefore introduce interesting discounts to make other appointments last longer.
Use the Basic Measurement The Total Number of Likes to assess the quality of the articles in general. To take into consideration only popular articles, add a Filter Views > 10. This way you can see the users activity on the article's page and whether the article's are successful overall.
Constants
KPI Constants are the special type of KPI Variables used when data can not be retrieved from modules and/or when figures remain the same during the whole period. For example, 'Total Investments' or 'Number of Employees' are often frozen for a specific period.
In comparison to measurements, KPI Constants are fixed and they do not depend on actual Odoo data. This allows the introduction of the figures which can not be retrieved from modules and/or which should remain the same during the whole period. For example, you might set the 'Total Size of Investments' to calculate return on investments, or the 'Number of Salesmen' to get sales revenue per person.
To create a Constant:
1. Go to Measurements > Constants
2. Click 'New'
3. Type the constant's title
4. Put the global value (the number which will be used for all periods, except for the specified ones)
KPI Constant value might be defined for each period.
Besides, for each period the app automatically tries to calculate a parent period. In one period is fully inside another one, the latter is considered as a parent for the former. For example, Y2024 (01/01/2024 - 12/31/2024) is a parent of Q3 (07/01/2024 - 09/30/2024); Q3 is a parent of July (07/01/2024 - 09/30/2024); but for 06/30/2024 - 07/31/2024, the parent would be Y2024, since this period is not fully inside Q3.
If there is value neither for this period nor for its parent, the global value would be applied.
To define a value for a particular time frame:
1. Start creating or editing a Constant
2. Find the tab 'By periods' and click 'Add a line'
3. Choose an existing period and type the value for this period, that will be used for calculations instead of the global value
As an example, let's create a constant 'Number of Employees'.
The Global Value - the general number of employees - is 20. This value will be used for all calculations containing the constant 'Number of employees'.
For the year 2024, however, we define the value as 21 employees.
But during the year we had some changes. In the first quarter of 2024, the company had 18 employees. During the second quarter, one more employee was hired, so we had in total of 19 employees. So let's add the value for these periods. Now, 18 is used for calculations for the first quarter of 2024 and 19 for the second.
As we don't state the number of employees for the third quarter, the value for its parent - Y2024 - '21' will be used for calculations.
For quarter 1 of 2024, there is no value and it doesn't have a parent value, so the global value - '20' would be applied.
Measurements (Variables)
Measurement (Variable) - is a specification of a basic measurement. The key idea is to simplify data preparation. You define 'Total Sales' once, and then unlimitedly use it for 'Sales Europe', 'Sales John Brown', 'Website Sales', etc.
Specify Basic measurements through the Odoo built-in domain constructor, which lets to filter by any storable attributes. Add more filters to Basic measurement by creating a Variable.
For example, create a Basic measurement 'Sales Count' for the Model 'Sale Order', which counts the number of sale orders. The Basic measurement uses the KPI Type 'Count of records'. Apply filters 'Status = 'sale'; Status = 'done'' to the Basic measurement. Based on the Basic measurements you can create other Variables: Sales Count America, and Sales Count Europe using the filter 'Sales Team > Sales Team contains 'Europe'/ 'America'. Or you can create a Variable to count sales of a particular salesperson, by the filter 'Salesperson ID = 2'.
Another example is based on the Basic measurement 'Opportunities: Average Expected Revenue' for the Model 'Lead/Opportunity', which calculates the average revenue and uses KPI Type 'Average of records field'. Based on this measurement you can create a Variable to count the average expected revenue only on the stage 'Won'. For that purpose, use the Filter 'Is Won = Won'. You can also create a Variable to see the expected revenue of a particular salesperson with opportunities only on the Won stage. You can use the same Filter 'Is Won = Won' and add one more 'Filter Salesperson ID = 2'.
Based on one Basic measurement you may create as many Variables as you need. Or you can create one Variable, by simply linking it to Basic measurements (Basic measurements are not used to create a formula by themselves). For example, create a Basic Measurement 'Total Sales' and link it to a Variable 'Total Sales'.
An exception is Basic measurements of the type 'Execute Python Code'. As they work on the code level, they cannot be anymore specified. So there can be only one linked Variable (see Execute Python Code).
There are two default Variables, that you can use for creating formulas within the time frame. You can find them right in the formula wizard (see KPI Scorecard). Those are:
1. 'Period Days' (the number of days in the period). KPIs with this Variable calculate the result based on the number of days in the current period. For example, Q3 (07/01/2024-09/30/2024) Period Days would be 92 days.
2. 'Days Passed' (the number of passed days in the period). KPIs with this Variable calculate the result based on the number of days passed in the current period. For example, Q3 2024 on the 15th of July would be 15 days, on the 1st of September - 62 days, and on the 30th of September - 92 days.
For example, you can see the Total Sales per Day. Both Variables apply to this KPI, but in the first case, you will see the accurate result only on the last day of the period, as it will compare the actual value with the total number of days in the period, even if the period is a month and at the moment only a few days have passed. The Variable 'Days Passed', on the contrary, will always show a more accurate result as will compare the actual value with the number of currently passed days. And each day the number of days will change (+1).
Let's create a KPI 'Total Sales' with the Variable 'Period Days', to find out how much you earn for a day. Set the KPI Target for the 3rd quarter of 2024. The length of the period is 92 days, so the Total Sales will be compared with the number of days in the period. At the beginning of the period, the results will be not accurate as a few days or weeks have passed and the period is not yet over.
Let's create the same KPI, but now with the Variable 'Days Passed'. Here the Total Sales will be compared with the number of already passed days. This number is dynamic and it changes as the days go by. So, we set a KPI Target for the 3rd quarter of 2024. Today it is the 15th of August, and therefore only 46 days have passed. Today the Total Sales will be compared with 46 days. Tomorrow with 47 days. So, the result is much more accurate, than when we use the Variable 'Period Days'(which is accurate only on the last day of the period).
Variables are used to create a KPI. The KPI may relate to a particular company. As you create a Variable choose the company it relates to, so only the objects related to the company will be considered for calculations. Therefore, you will be able to calculate, for example, the 'Total Sales' of each of your companies separately. For instance, create a Variable 'Sale Team America > company USA' and 'Sales Team Europe > company Belgium' and assign each to the corresponding company. If you don't specify the company, then KPI Variables would be available for all users of all companies. Otherwise – under a certain company, users would be able to see only those related to that company objects.
To create a Variable:
1. Go to Measurements > Measurements (Variables)
2. Click 'New'
3. Type the name of the Variable
4. In the field 'Measurement' choose a Basic measurement
5. Choose a company or leave the field empty, to make this Variable global
6. Optionally add some filters
From a Basic measurement form view, you can access all linked variables:
1. Go to Measurements > Basic measurements
2. Open any Basic measurement
3. In the top right corner of the Basic measurement you will see the number of Variables, based on it
4. Click on the button to see the list of Variables
5. Click on any Variable to see its card
Variables Examples
Here you can find some possible Variables that specify useful Basic Measurements (see Basic Measurements Examples).
1. Basic Measurement - Leads and Opportunities Count
You can separate Leads from Opportunities, to see the result for each separately. For that add the Extra Filter Type = Lead or Type = Opportunity.
See only Leads and Opportunities with high probability. You can manually set how high it should be. Add the Extra Filter Probability >= 70. 70 is the percent number.
See only won Opportunities, to compare their number by periods and track the effectiveness of work. Add the Extra Filter Is Won = Won.
2. Basic Measurement - Confirmed/Done Sale Orders Total
Even if there is no need to specify the Basic measurement, match it to a Variable, so it was visible in the formula wizard. As the Basic measurements are not used for creating a formula (see Basic Measurements). Create a Variable 'Total Sales' to see the amount of money that was earned on sales.
Specify the Basic measurement to see the Total, that a particular team earned. For that add the Extra Filter with the name of the team Sales Team > Sales Team contains 'Europe'. If you have several teams and want to see the Total result by teams you need to create a Variable for each team separately.
You can also see the result per each salesperson, to stimulate employees to sell more and get some benefits. For that add the Extra Filter with the person's ID Salesperson > ID = 9.
3. Basic Measurement - Customer Invoices Count
Specify the invoices by their status. To count all the posted invoices add the Extra Filter Status = Posted.
Track the number of cancelled invoices, to take timely measures and find out what is the problem, if too many were cancelled. Add the Extra Filter Status = Cancelled.
Find out how many invoices with the high Total amount were created. For that add the Extra Filter Total > 100.
4. Basic Measurement - Purchase Order Total
Even if there is no need to specify the Basic measurement, match it to a Variable, so it was visible in the formula wizard. As the Basic measurements are not used for creating a formula (see Basic Measurements). Create a Variable 'Purchase Order Total' to see the amount of money that was spent on products.
If you have vendors from various countries and pay them in different currency, you can add, for example, the Extra Filter 'Currency contains US'. This way only the purchases in US dollars will be taken into consideration.
Simultaneously, it is also possible to convert all currencies to the default company one to see the result in it. In this case, to calculate the purchase total regardless the currency, you can set another Basic measurement and Variable.
To that end edit the Basic measurement or create a new one and change the Model to 'Purchase Report'. This kind of Model and similar ones (like Sale Report, etc.) are insensitive to the currency. So, the total will be summed already in default company currency.
For example, create a Basic measurement 'Purchase orders total in default currency', and choose the Model 'Purchase Report', add an Extra Filter by the country or vendor is you like (e.g. Country contains America) and after the calculations the result will be shown in the default currency.
Specify the Basic measurement to calculate the money spent for the products of a particular vendor. Add the Extra Filter Vendor = 'Azure Interior'
5. Basic Measurement - Working Days to Close
Connect Basic measurement to a Variable with the same name to see the number of days that the company spent to finish all the projects.
Create a Variable to see the number of days that Anita Oliver needed to finish the assigned to her projects. For that, use the Extra Filter with the workers ID 'Assigned To > ID = 9'.
Create a Variable to see the number of days that the company spent to finish the particular project. For that, use the Extra Filter with the Project's title 'Project > Name = 'Software Continuous Development'.
6. Basic Measurement - Products in Stock
Specify the Basic measurement to count stocks of the products, that have incoming inventories to a particular warehouse in a specified period. For that add the Extra Filter with the location title Location contains WH/Stock.
Count incoming inventories of only expensive products in your shop. For example, those that price is more than 100 $. For that add the Extra Filter Product > Sales Price > 100.
Calculate incoming inventory of specific product or products. Add the Extra Filter with the product's name, for example Product contains Large Cabinet.
7. Basic Measurement - Average Duration of an Appointment (for the module Universal Appointments)
If you hold various appointments in different languages that vary in time, you can filter them by the language and calculate the average time of an appointment. The language of the appointment is decided based on the language of the appointment's partner. Add the Extra Filter Language = English.
Calculate the average time for an appointment for a particular service. To see for which service customers book more time. Add the Extra Filter with the name of your service Service = Car Rent Class C.
Track for which of your employees customers book more time. Add the Extra Filter with the responsible for the appointment person Responsible = Anita Oliver.
8. Basic Measurement - The Total Number of Likes in an Article (for the module KnowSystem)
Track the number of likes, for the articles, which are published. This way you will be able to track likes for only those articles, which can be liked by both internal users and portal users. Add the Extra Filter Is Published is set.
See the total number of likes for the articles with a particular tag. You can later compare, articles with what tag gets more likes and therefore is more popular among users. Add the Extra Filter with any of your tags, for example Tags > ID = 3. You can find out the required tags's ID as you open the tag from the tag's menu, in the address line 'odootools.com/web#id=3...'.
You might want to consider the number of dislikes to an article, while counting the total number of likes. Add the Extra Filter Dislikes Number < 5. With this Filter, only the articles that have less or equal 4 dislikes will be considered for calculations.
KPI Periods
KPI Scorecard assumes that you might not only have an overview of actual figures but you can also compare those to real targets. However, goals should be time-constrained (for example, 'Sell as much as Possible' is not a goal, while 'Generate 100,000 Euro Revenue in the year 2024' is a good target for a salesperson). That is why KPI Periods are introduced.
A KPI Period is a time frame for which companies set their targets to control performance (in a similar way as financial performance is controlled within accounting/fiscal periods).
The app allows setting periods of any length including intervals that intersect each other (and even the Past periods). For example, you can create some ordinary periods by years, quarters, months, weeks, and days like 'The Year 2024', '1st Quarter of 2024', '2nd Quarter of 2024', 'September 2024' etc. Or make unusual periods - 'September 1st to 17th' and 'September 7th to 30th'.
When periods cross each other like in 'The Year 2024' and '1st Quarter of 2024', the objects that were created during the crossing time are used for calculations in both periods. For example, we had 100 sales in 2024, and 20 of them related to the first quarter of the year.
There are two ways of creating a period: through the separate menu or right from the KPI Scorecard interface.
To create the period from the KPI Scorecard Interface:
1. Click on the button 'New'
2. Write the title of the period
3. Choose dates
4. Optionally choose the period to copy the KPI Targets from (to avoid the double work and not to create them again)
5. If you have more than one company, choose the one for which you create the period (in multi-company mode: it cannot be global, should be created for each company separately)
To create a period from the separate menu:
1. Go to the tab 'Periods'
2. Click 'New'
3. Type the period's name
4. Choose the start and end date
5. In multi-company mode choose the company
6. Optionally add some KPI Targets right from here
The chosen dates will be used to calculate the KPI actual value. For example, a KPI formula might include a basic KPI measurement for the total amount of sale orders, while the date field of this measurement is defined as 'Order date'. Then, only sale orders, whose order date is within the period, would be taken into account. Thus, the KPI Scorecard would show the total revenue for a given period. This way the KPI may be used for any period and as many times as you need. As the dates will be taken from the period, where the KPI Target (based on the KPI) is set.
To compare results for certain periods and see them in a graph, it is recommended to have a more or less strict logic of periods. Usually, KPI targets are set for a whole year and quarterly/monthly intervals. It lets us not only have a KPI overview but also check historical trends.
The app automatically considers various periods that might be compared and shows users a chart of actual values by a specific KPI. To consider periods similar, they should have the same number of days adjusted for a history tolerance.
On the KPI single view interface, сlick on the 'History' button, to see the automatically created graph of the KPI Target for various periods. Below the graph, there is a table, which shows the chosen KPI Target for all the periods, regardless of the number of days in them. Also, you can analyze tendencies by periods on the special 'KPI trends' interface (see KPI History and Trends).
When the end date is already in the Past, it is preferable to close the period to avoid further updates of KPI targets' actual values due to further corrections (it is not a good idea to update December KPIs in the next August even though a sale total needs to be corrected, for example). This action is pretty much the same as when an accountant finishes a fiscal year.
Close periods that have already passed, to avoid further recalculations and lock the values. You can always re-open a period if you closed it by mistake or want to revise something. There are 2 ways to close and re-open a period:
1. From the KPI Scorecard Interface, in the left navigation panel
2. In the tab 'Periods', by choosing a period and clicking 'Close Period'/ 'Re-Open Period'
KPI Periods let you also copy targets from existing periods (so, use them as a template). To that end just push the button 'Substitute targets' and select a period with proper KPI Targets. After that the list with the KPI Target from the chosen period will be created for the current period as well, The KPI formula and KPI Target will remain the same, but calculations will take place already for the current period.
For example, you have 3 KPI Targets (Total Sales - 10000$; Sale Orders Count - 100; Europe Sales Share - 60%) for the first quarter of 2024 - period 'Q1 of 2024'. You create the period, that represents the second quarter of 2024 - 'Q2 of 2024'. As you open the period, you see that it is empty and you need to set KPI Targets. Then, instead of creating each one again for the second quarter, you can substitute targets. Then, the list of KPIs is copied to the current period, and in both periods you see the same list of KPI Targets (Total Sales - 10000$; Sale Orders Count - 100; Europe Sales Share - 60%).
It significantly saves time, since KPI targets usually remain similar for periods of the same length. After that action, you would be still able to change the KPI Target of the current period and calculate the Actual Value for the donor period (of course until you close the period).
To substitute targets:
1. Open the new period in the left navigation panel, to which you want to copy the KPI Targets
2. Choose the period from which you want to copy KPI Targets
3. Click 'Substitute Targets'
4. All KPI Target from the chosen period will be copied to the new period
5. Delete the ones you don't need anymore, by clicking on a cross on the KPI card.
KPI (KPI Formulas)
KPI or KPI formula is an instruction on how to get the required data from Odoo for further calculations. That determines how to count the 'Actual Value' in the KPI Target card. This is the third and final level of the way to get the data from Odoo.
There are the following levels of getting the data from Odoo:
1. Basic Measurements (the core configuration object used for retrieving actual KPI values from Odoo data)
2. Constants (the value that cannot be extracted from Odoo, but you need it for calculations) and Variables (the connected, or specified basic measurements that are required to make a formula)
3. KPI (the formula/instruction for Odoo which defines how to calculate figures based on existing Odoo data and settings)
KPI formulas might combine any number of variables, constants, and other KPIs with mathematical operators. Basic Measurements cannot be used to build a KPI.
The drag-and-drop formula for KPI construction is as simple as it is to write down a mathematical expression: just drag and drop the parts in the right order with the correct operators. Odoo would automatically retrieve data from a database according to a defined parts order for a specified period.
Creating a KPI
To create a KPI formula:
1. Go to the tab KPIs
2. Click 'New'
3. Drag&Drop Operators, Measurements, Other KPI, and Constants to create a formula (see The Interface of the Formula Wizard)
4. Below the Formula wizard, choose the category of the KPI (see KPI Categories)
5. Choose a parent KPI (see KPI Scorecard Interface)
6. Optionally, if you turned on 'KPI Tags' in configuration, assign one or several tags to the KPI (see KPI Tags)
7. Choose a company of the KPI (see Access Rights)
8. Apply the success criteria (The more the better, The less the better) (see KPI Settings)
9. Choose the result type (see KPI Settings)
10. Optionally add result prefix and/or suffix (see KPI Settings)
11. Choose how to round decimals (see KPI Settings)
12. In the tab 'Extra Targets Security' set the access rights for the current KPI formula (see Access Rights)
13. Optionally, add some notes in the tab 'Notes'.
There is a way to see all created KPIs one by one to see their formulas or check the settings. To switch between KPIs quickly:
1. Open any KPI in the tab KPIs
2. Move between KPIs with the help of the back-and-forth arrows
The Interface of the Formula Wizard
The Formula Wizard is the central configuration object, which introduces the tool to construct mathematical expressions in a user-friendly manner through drag and drop. With the help of the convenient interface, you can easily create KPIs and configure them (see KPI Settings).
The interface is divided into two parts: the left part with elements for the formula and the right part, where you create the KPI.
In the left part of the interface you see the following elements, which can be used to create a KPI:
1. Various operators
2. KPI Variables (including the default Variables 'Period Days' and 'Days Passed', that are required for introducing a time frame into the formula) in the tab Measurements (see Measurements (Variables))
3. Other KPIs (the previously created formulas)
4. KPI constants (see Constants)
The section Other KPIs contains previously created formulas, that you can use for creating even more complicated ones. For example, 'Opportunity to sales success ratio' based on KPIs 'Sales count' and 'Opportunities Count')
The formula might be as complex as you require. The available operators are:
1. Subtraction (-)
2. Addition (+)
3. Multiplication (*)
4. Division (/)
5. Opening and closing brackets
6. Exponent (**)
7. Custom float number (write any number in the box to use it in your formula)
Make sure the operators comply with basic Math rules.
To create a KPI, move elements from the left side of the interface to the right side by Drag&Drop. When elements get to the right side, they change their color according to their type:
1. Operators become red
2. Measurements become green
3. Other KPIs become blue
4. Constants become grey
This way, it is easier to distinguish them in the formula.
In case, there are some critical mistakes in the formula, a warning above it will be shown.
KPI Settings
After creating a formula by Drag&Drop, it is necessary to finish the setup by configuring its settings. The tab 'Settings' is located below the formula wizard.
There you can set:
1. Category (see KPI Categories)
2. Parent KPI (see KPI Scorecard Interface)
3. Tags, if the feature 'KPI Tags' is enabled in configuration (see KPI Tags)
4. Company (if you work in a multi-company environment)
5. Sequence (see KPI Scorecard Interface)
6. Success criteria
7. Result type
8. Result Prefix
9. Result Suffix
10. Currency (for the monetary result type)
11. Rounding decimals
In order, to track the result in the column 'Actual Value' in the KPI Scorecard Interface, which is marked by the color (see KPI Scorecard Interface) you need to choose the success criterion. There are two available success criteria: 'The more the better' and 'The less the better'.
For example, use the criterion 'The more the better', in KPI 'Total sales' or 'The number of sales for 2024'.
For example, use the criterion 'The less the better', in KPI 'Canceled orders' or 'Lost Opportunities'.
Simultaneously, you can choose the result type of the KPI. There are three options: number, percentage, and monetary. Depending on the result types there are some changes in the fields.
To the number and percentage result types, you can add a prefix and suffix to make the results look good. 'Prefix' - is a word or a sign, that will be displayed before the result. 'Suffix' - is a word or a sign, that will be displayed after the result. By default, the percentage result type has the suffix %, which can be changed.
The monetary result type doesn't have fields 'Prefix' and 'Suffix', but it adds the field 'Currency', where one of the used currencies can be chosen.
The module KPI itself doesn't convert currency, so, for the correct calculations, all company transactions should be in one currency. Optionally, you can use the model 'Sales Analysis reports', when you create a basic variable. Then the currencies will be analyzed and calculated into one, which is the default for the company.
Sometimes in some formulas, the result may have a reminder, for example after division. To make the result look better, define rounding rules from 0 to 4 decimal points (1 > 1.2 > 1.23 > 1.235 > 1.2346). After that, only up to 4 numbers after the dot will be shown.
KPI Examples
Here you can find some useful examples, based on our previously created Variables. We can distinguish several kinds of formulas:
1. KPIs, consisting of one Variable. This kind of KPI doesn't require any other operators. The whole formula is one Variable. To create such KPI, you need to simply drag and drop the required Variable to the right side of the interface.
All Variables from the list of examples can be used for creating such KPIs. Just create the corresponding KPI to be able to set a KPI Target.
2. KPIs, consisting of 2 or more Variables. This kind of KPI represents a complex formula, where you add several Variables and some operators.
Here are some examples with previously created Variables:
Use this KPI to see the percent of won opportunities. The number of opportunities on the stage 'Won' is compared with the total number of opportunities.
For example, you have 5 won opportunities and 10 opportunities in total. The set KPI Target was to have at least 70% of the won opportunities. Thus, the result is negative, as there is only 50% of the won ones.
Keep in mind, that to count the result in percent you need to choose the Result Type 'Percentage'. As for the success criteria, in this case, it should be 'The more the better' as we want to won opportunities to prevail.
Use this KPI to see the percent of sales of one of your teams, for example Europe. The total earned by the team Europe is compared with the total earned by the whole company.
For example, the team Europe earned 100$, while the total sales were 1000$. As we have 20 teams, the KPI Target was to earn 5% from the total sales. The team showed a great result and doubled the target. Whether that was the success of the team Europe, or failure of the other teams considers further investigations.
Keep in mind, that to count the result in percent you need to choose the Result Type 'Percentage'. The Success Criteria can be 'The more the better', as the team should show the good results.
Use this KPI to see the amount of money earned per employee. The total earned by the company is compared with the number of employees per company, which was created as a constant.
For example, total sales were 1000$. We have 20 employees, the KPI Target was to earn 40$ per worker. The result is 50$, so the target is reached.
The number of employees might be different for various periods of time. The corresponding configurations, can be made while creating the constant. The constant will be chosen considering the period for which the KPI Target is set (see Constants).
The Result Type for receiving the value in money should be 'Number'. The Success Criteria can be 'The more the better', as the team should show the good results.
Use this KPI to see average amount of money earned per order. The total earned by the company is compared with the number of sale orders.
For example, total sales were 1000$ and we had 50 sale orders, the KPI Target was to have the average receipt for 50$. The result is 50$, so the target is reached.
The Result Type for receiving the value in money should be 'Monetary'. The Success Criteria should be 'The more the better', as the we people to buy more at a time.
Use this KPI to see the amount of money Anita Oliver earned per day. The amount of money that Anita Oliver have earned is compared with the number of days, that Anita Oliver needed to close all her projects.
For example, Anita Oliver had 5 projects per 20 working days. In total she earned a 1000$, so the amount of money, that she have earned per day is 50$. The KPI Target is to earn 60$ per day, so the result is negative and Anita should work faster.
The Result Type for receiving the value in money should be 'Monetary'. The Success Criteria can be 'The more the better', as we want Anita Oliver to earn more money.
Use this KPI to calculate the percent of cancelled invoices. The total number of invoices is compared with the number cancelled invoices.
For example, there were about 50 invoices created. 5 of them were cancelled later. The KPI Target was to have less than 5% cancelled invoices. The result is 10%, so the target is not reached.
The Result Type for receiving the value in money should be 'Percentage'. The Success Criteria should be 'The less the better', as we don't want invoices to be cancelled.
Use this KPI to see the percent of likes for an article with the particular tag. The number of likes per article with the tag is compared with the total number of likes.
For example, total number of likes was 100. The number of likes for articles with the tag 'Odoo' was 40. The KPI Target was to have 50% of likes for articles with the tag. The result is 40%, so the target is not reached. But, here we need to consider also our KPI Target for The Total Number of Likes. Maybe, we have just received much more likes than hoped.
The Result Type should be 'Percent'. The Success Criteria can be 'The more ther better', as we want articles with the tag 'Odoo', to receive praise among readers.
3. Complex KPIs, with Variables of time (Period Days, Days Passed)
Period Days - shows the number of days in a period.
Days Passed - shows the days of the period that have passed for the current day. Unlike the period of days, shows a more accurate result at the beginning of the period. When using Period Days, at the beginning of the month the results may be drastic, as there wasn't enough time to show good results.
For example, you set the KPI Target to see Total Sales per Period. Let's say you want to earn a1000$ per month (1.09 - 30.09). Now it is the 3rd of September and the company earned 200$ by now.
If you use the KPI Formula Total Sales / Period Days, then 200 will be divided by 30 (the total number of days in the period) and therefore the result will be negative and will not reflect reality. As 200& per 3 days is a good result compared to our target (1000$).
If you use the KPI Formula Total Sales / Days Passed, then 200 will be divided by 3 (days passed by now) and the result will be marked as positive. As the calculations take place every day, the next day the module will already divide the Total Sales by 4, then by 5, and so on. So, the result will be always acute.
Use this KPI to see the average profit for a week. The total earned on sales is divided by the passed time (in weeks).
For example, for the month we have earned a 1000$. Thus, 4 weeks have passed. The KPI Target was to earn 200$ per week. The result is 250$, so the target is reached.
The Result Type should be 'Monetary'. The Success Criteria can be 'The more ther better', as we would rather earn more per week.
Use this KPI to see the average profit for a day. The total earned on sales is divided by the days passed.
For example, today it is the 20th of September and by now we have earned a 1000$. The KPI Target was to earn 50$ per day. The result is 50$, so the target is reached. But we still have 10 more days till the end of September, so we should keep up with it.
The Result Type should be 'Monetary'. The Success Criteria can be 'The more the better', as we would rather earn more per day.
KPI Categories
A KPI Category – is KPIs storage, which is used for convenient navigation over KPIs and managing access rights to them. To control KPIs related to specific areas combine them into corresponding categories. For example, to check targets only in sales (category 'sales') or targets of a specific sales team (category 'sales > sales team Europe').
Each KPI should be assigned to a single category, in order to find required targets quickly just by checking the boxes on the scorecard interface.
Categories support hierarchy. A category may have a parent and sub-categories.
To create a category:
1. Go to Configuration > Categories
2. Click 'New'
3. Type the category's name
4. Choose the parent category, if any
5. In multi-company mode, choose the company
6. If you want some users or user groups to have access to see the category and its KPI Targets, state them in the 'Read Rights' section (see Access Rights)
7. If you want some users or user groups to have access to edit the KPI Targets of a category, state them in the 'Edit Rights' section (see Access Rights)
8. Optionally, add some notes in the tab 'Notes'.
Move the categories in the list (Configuration > Categories) by drag and drop to change their sequence. This will help to keep a particular order in the left navigation panel of the KPI Scorecard Interface. Keep in mind, that the order of sub-categories will not affect the order of the parent categories. Therefore sub-categories will always follow their parent category.
If you have a lot of categories and sub-categories, then you may find it difficult to navigate through them and select the ones you need quickly. Thus, for extra convenience, a special search bar above the categories list in the single-view interface was introduced. Just start typing the word and click 'Enter' or the search button and the matching results will be shown and marked red. Click the button 'Reset' on the right side of the search bar to empty the search.
KPI Tags
With the help of tags, you can structure KPIs, for the convenient management of the related KPI Targets. This way, you can create your own classification of KPIs, which reflects the specifics of the business. For example, create tags according to the sphere of the related KPIs, related users, or importance.
To create and manage KPI Tags the option 'KPI Tags' in the module's settings should be enabled. After that, the tree of tags will appear in the KPI Scorecard Interface and the separate KPI Tags menu will appear.
There are two ways to create tags: through the separate menu or by typing the tag's name in the field 'Tags' and clicking the button 'create' as you create or edit a KPI Formula.
Tags support hierarchy. A tag may have a parent and sub-tags.
To create a tag through the separate menu:
1. Go to Configuration > KPI Tags
2. Click 'New'
3. Type the tag's name
4. Choose the parent tag, if any
5. In multi-company mode, choose the company
6. Optionally, add some notes in the tab 'Notes'.
You can assign tags to a KPI, in the field KPI Tags. A single KPI might have an unlimited number of tags assigned.
If you have a lot of tags and sub-tags, then you may find it difficult to navigate through them and select the ones you need quickly. Thus, for extra convenience, a special search bar above the tags list in the single-view interface was introduced. Just start typing the word and click 'Enter' or the search button and the matching results will be shown and marked red. Click the button 'Reset' on the right side of the search bar to empty the search.
KPI Scorecard Interface
The next step, after creating one or several KPIs is – setting a KPI Target. Setting a KPI Target implies setting a goal. For example: to earn 50000 for the first quarter of 2024. Setting a KPI Target helps to track the company's progress in reaching that goal, and take preventive measures if there is a negative tendency in the current results.
The KPI Target is set for a particular period. In the main module interface, you can switch between all created periods to see the list of set KPI Targets for each.
Manage KPI Targets by updating the target values, if necessary.
Set the KPI Target once and use those multiple times for different periods to avoid double work with the help of the function 'Substitute Targets'.
Compare the Actual Result of the same targets for similar periods on a graph, to make future KPI Targets more reasonable.
KPI Targets
KPI Target is the key element in evaluating the result of a company's, its teams, or an employee's work. KPI Target is your plan for a particular KPI for a given period. By setting up a target value, you indicate, which result, you would like to achieve by the end of the period and track the actual result to detect flaws.
To set a target:
1. Click on the button 'Set Target'
2. Choose the KPI formula
3. Type the target value
4. Click 'Save&Close'.
The KPI Target is created for the period, that is chosen in the left navigation panel.
As you set the KPI Target, it appears in the target list in the main panel. Each KPI Target card includes the title, actual value, target value, and actions panel.
Actual value lets you track the current progress toward fulfilling the target's value. Depending on the chosen 'Success Criteria' (the more the better or the less the better) the Actual Value is analyzed according to the target value and the result is marked by the color (see KPI formulas).
If the actual value is red, then it shows a negative result. The green actual value shows a positive result. If you added some notes to a KPI, then as you hover over the linked KPI Target the note will appear.
A grey KPI Target with an exclamatory mark and 'N/A' in the field 'Actual value' shows that either there is not enough data for calculation or there is a mistake in the formula. Hover over the exclamatory mark to see the error type.
The KPI interface displays a progress bar column, which counts percent completion for positive goals and positive actual values. It works differently for different success criteria (The more the better, The less the better).
If the success criteria 'The more the better is chosen', then the shown colors have the following meaning:
1. Red - the KPI Target is under-fulfilled
2. Green - the KPI Target is fulfilled
3. Green with stripes - the KPI Target is over-fulfilled
If the success criteria 'The less the better is chosen', then the shown colors have the following meaning:
1. Red - the Actual Value is overspent
2. Green - the Actual Value is within the KPI Target
3. Green with stripes - the Actual Value is lower than the KPI Target and, can be further raised
In case, the percentage has got over 100, it is still shown graphically up to 200, while the width of 1% in each row remains the same.
On the right side of a KPI Target's card, there are some buttons, that you can click:
1. Change Target
2. See the history
3. Delete Target
To change the Target, click on the 'Change Target' icon on the right side of the KPI Target. In the pop-up window, you will be able to switch between available KPIs and type manually the target value.
If you have enough data and several same KPIs for different periods you can see the KPI history. To see the history of KPI by periods click on the 'History' icon. In the pop-up window, you will see a diagram of 'History by similar periods'. The app automatically considers various periods that might be compared to this one, and shows users a chart of actual values by a specific KPI (see KPI History and Trends).
To Delete the Target, click on the 'Cross' icon on the right side of the KPI Target. In the pop-up window, you will be asked to confirm the decision.
The KPI Target's list is formed according to the hierarchy. Hierarchy allows highlighting targets with indicative padding for an instant overview of sub-KPI Targets.
The Hierarchy is set according to:
1. KPIs sequence
2. Parent/child relations
To change the sequence of KPIs, move them in the tab KPIs by drag&drop or open any KPI and type the number in the field 'Sequence'. To be on top, the sequence should be smaller.
KPI's relations are more important than the sequence, so the parent KPI will always be higher, than its sub-KPIs. And the sub-KPIs will not be divided by other KPIs, no matter what their sequence is.
You can set the parent KPI below the Formula wizard as you create or edit KPI (see KPI (KPI Formulas)).
All the calculations in the KPI module are made due to the system schedule, once or twice per day. So, as you set the KPI Target you don't see the current result right away. But, you can also trigger the calculation manually by clicking 'Calculate' in the KPI Scorecard interface.
After setting a Target, keep in mind, that calculations take place according to the system schedule. To avoid waiting and see the 'Actual Value' right away - click 'Calculate'.
You can change the frequency of the automatic KPI calculation. For that:
1. Go to Configuration > Settings
2. Click 'Configure Cron Job'
3. In the field 'Execute every' choose the number and type of period the actual KPI should be recalculated
4. Click 'Save'.
The module supports the export of KPIs. The KPIs are exported and imported in the .xlsx format.
To export KPIs:
1. Click on the button 'Export KPI' in the KPI Scorecard Interface
2. The downloading will start automatically
The KPIs are exported for a particular period, which is chosen in the left navigation panel. The following fields are exported: KPI, KPI Target, Actual Value, and Notes. The exported KPIs save the order and are structured according to the hierarchy. The file itself is named after the period that it represents.
KPI Periods
The displayed KPI Targets list belongs to the period, which is chosen in the left navigation panel. Switching between periods allows you to see all KPI Targets that belong to a particular period. To switch between periods click on the dates line and choose the period for which you want to see the KPI Targets.
When the end date is already in the Past, it is preferable to close the period to avoid further updates of KPI targets' actual values due to further corrections (it is not a good idea to update December KPIs in the next August even though a sale total needs to be corrected, for example). This action is pretty much the same as when an accountant finishes a fiscal year.
Close periods that have already passed, to avoid further recalculations and lock the values. You can always re-open a period if you closed it by mistake or want to revise something. There are 2 ways to close and re-open a period:
1. From the KPI Scorecard Interface, in the left navigation panel
2. In the tab 'Periods', by choosing a period and clicking 'Close Period'/ 'Re-Open Period'
Periods are important for the calculation of Actual Value. Only objects within the period dates are considered for the calculation according to the chosen Date Fields for a Basic Measurement. For example:
1. You created a Basic Measurement 'Done Sale Orders: Total'
2. In the 'Date fields' choose 'Order Date'
3. Connected a Variable 'Done Sale Orders: Total', so it appeared in the formula (as Basic Measurements can't be used directly for formulas)
4. Created a period 'Year 2024' and stated its dates
5. Created a formula and set a KPI Target for the period 'Year 2024'
6. Only Sale Orders, which have been created in 2024, will be considered for calculations of Actual Value
This way, when the dates are not used in measurement or KPI - there is no need to rewrite them for each period. You can use the button 'Substitute Targets' to copy KPI Targets from one period to another. It significantly saves time, since KPI targets usually remain similar for periods of the same length. After that action, you would be still able to change the actual scorecard for this period (of course until a period is closed) (see KPI Periods).
To substitute targets:
1. Open the new period in the left navigation panel, to which you want to copy the KPI Target, and click 'Substitute Targets'.
2. In the pop-up window, choose the period from which you want to copy KPI Targets
3. Click 'Substitute Targets'
4. All KPI Target from the chosen period will be copied to the new period
5. Delete the ones you don't need anymore, by clicking on a cross on the KPI card.
To track the fulfillment progress and changes in achieving the KPIs, use the 'History' button on the right side from a KPI Target in the KPI Scorecard Interface. It allows comparing the KPI Targets and Actual Values by similar periods. To be considered, the periods should have the same number of days adjusted for a history tolerance (see KPI History and Trends).
Navigation
There are several ways to navigate among the KPI Targets:
1. By the category
2. By tags, if the feature 'KPI Tags' is enabled in the configuration
3. By the search bar
4. By referring, to the previously saved search parameters
KPI Categories is a great tool, which allows storing connected KPI Targets and browsing between them quickly. Categories also allow managing access to the KPI Targets in a batch (see Access Rights).
Tick a category to see all its KPIs. If you choose a parent category, you will see all KPIs of its subcategories as well. To reset the choice click on the icon '' by the word 'Categories' (see KPI Categories).
If you have a lot of categories and sub-categories, then you may find it difficult to navigate through them and select the ones you need quickly. Thus, for extra convenience, a special search bar above the categories list was introduced. Just start typing the word and click 'Enter' or the search button and the matching results will be shown and marked red. Click the button 'Reset' on the right side of the search bar to empty the search.
Simultaneously, you can use the search bar above the main part of the interface to find the KPI Targets by the connected KPI. Just start typing the KPI's title and click 'Enter'. To reset the search click on the cross by it.
Create any classification of KPIs with the help of tags. For example, create user-related tags or tags to mark the importance of certain KPIs. Make sure, that the option 'KPI Tags' is enabled on the configuration page.
Tick a tag to see all its KPIs. If you choose a parent tag, you will see all KPIs of its sub-tags as well. To reset the choice click on the icon '' by the word 'Tags' (see KPI Tags).
If you have a lot of tags and sub-tags, then you may find it difficult to navigate through them and select the ones you need quickly. Thus, for extra convenience, a special search bar above the tags list was introduced. Just start typing the word and click 'Enter' or the search button and the matching results will be shown and marked red. Click the button 'Reset' on the right side of the search bar to empty the search.
It is possible to save search parameters, to access the search result quickly. For that:
1. Apply one or several search parameters
2. Click 'Favorites'
3. Choose 'Save current search'
4. Type the search name
5. Tick 'Use by default', if you want to see the KPIs this way as you open the app, OR tick 'Share with all users' if you want other people to be able to see and apply these search parameters
6. Click 'Save'.
After that, you will be able to switch to this search quickly by clicking 'Favorites' and choosing it.
KPI History and Trends
The module tracks the history of set KPI Targets and related Actual Values by periods. To compare results for a certain time and see them in a graph, it is recommended to have more or less strict logic of periods. The app automatically considers various periods that might be compared and shows users a chart of actual values by a specific KPI. To consider periods similar, they should have the same number of days adjusted for a history tolerance.
For example, you have 2 KPI Targets 'Total Sales' and 'Sales Count'. The first KPI Target is set for each quarter of 2024 and the year 2024. The second KPI Target was set twice for a monthly period, once for the year 2024 and once for the first quarter of 2024. The KPI Target 'Total Sales' will have an automatic graph generated by the quarters (featuring those, that have already begun or passed), as the periods are rather similar. As for the KPI Target 'Sales Count', it will be impossible to generate a corresponding graph, but still, we will be able to see the table below it with the results for all available periods.
Sometimes the length of periods cannot be precise, for example, in February there are 28/29 days. So, you can instruct the module on which periods should be considered similar by defining the tolerance on the configuration page.
To set the tolerance go to Configuration > Settings and find the field 'History Tolerance'. Type the difference (number of days), that periods can have to be considered similar. For example, 7-day periods might be compared to 5-day and 9-day periods. Then, tolerance would be 2.
It is necessary to have at least a 2-day tolerance to compare quarterly periods (since a quarter might take from 90 to 92 days), and a 3-day tolerance for months (as February may last 28 days).
In the KPI Scorecard Interface, click on the 'History' button, to see the automatically created graph of the KPI Target for the related period. Switch between bar and line graphs to conveniently analyze the results. By default, the line graph is shown.
On the graph, you will see the set KPI Target and the Actual Value for the related period. Both the goal and the actual value can be hidden from the chart. Just click on the related label above the graph. Click one more time, to make it visible on the graph again.
The progress of the KPI completion is expressed by the color scheme.
On the line graph, red color shows that the KPI Target is not completed, light green color that the target is over-fulfilled, and dark green color that the KPI Target is planned and fulfilled.
On the bar graph, the KPI Target is always green and the Actual Value can be red (the goal is unfulfilled); or green (the goal is completed).
Below the graph, there is a table, which shows the chosen KPI Target for all the periods, regardless of the number of days in them.
KPI Managers can also see the statistics of the KPI fulfillment in the KPI trends interface. The related button can be found in the systray as you open the KPI app. KPI Trends contain a list of all history charts/graphs for all KPIs, which have KPI Targets set.
Depending on the existing periods, Odoo will calculate the available period types according to the specified tolerance parameter. This way goals will be shown by duration, f.e. Quarterly and yearly goals. To see the statistics for all available period types, choose the option 'All period types'.
In case you work in a multi-company environment and have access to several companies, you can switch between them to see the related KPIs.
For all charts, you can switch between the line/bar view. Just choose the type of view in the left functional interface.
For all charts at once, you can hide KPI Targets/Actual Values. To show hide KPI Targets, click the slider button 'Show Targets'. To show hide KPI Targets, click the slider button 'Show Targets'.
You can filter KPIs by category, for that, just tick the category/categories in the left functional interface. If you choose a parent category, you will see all KPIs of its subcategories as well. To reset the choice click on the icon '' by the word 'Categories'.
If you have a lot of categories and sub-categories, then you may find it difficult to navigate through them and select the ones you need quickly. Thus, for extra convenience, a special search bar above the categories list was introduced. Just start typing the word and click 'Enter' or the search button and the matching results will be shown and marked red. Click the button 'Reset' on the right side of the search bar to empty the search.
If the option 'KPI Tags' is enabled, you can also filter KPIs by tags. For that, just tick the tag/tags in the left functional interface. If you choose a parent tag, you will see all KPIs of its sub-tags as well. To reset the choice click on the icon '' by the word 'Tags'. Optionally, use the tags searchbar above to find the ones you need quickly.
The list of available charts will be seen in the main interface. Above you will see the Reference of the KPI, the '' icon button, that allows expanding the graph on the whole screen and hiding it back, and the buttons to switch between the line and bar graphs.
You can show/hide KPI Targets/Actual Values of a particular graph. For that, just click on the related label above the graph. Click one more time, to make it visible on the graph again.
Scroll down to see all available history graphs or use the KPI filters, which are organized hierarchically in the left functional panel, to find the related KPI Targets quickly. For that, just tick one of the KPIs. If you choose a parent KPI, you will see all included KPIs as well. To reset the choice click on the icon '' by the word 'KPIs'.
Above the KPIs filters in the left functional panel, you will also find a search bar to find the required ones quickly. Just start typing the word and click 'Enter' or the search button and the matching results will be shown and marked red. Click the button 'Reset' on the right side of the search bar to empty the search.
Access rights
Rights to administrate KPI belong to 2 user roles: 'KPI User' and KPI Manager'. If the internal user doesn't have one of the KPI roles assigned, the related menu will be hidden for such a user.
Simple KPI users see only the KPI Targets to which they have rights. They can set targets for available to them KPIs and can edit targets based on the KPIs, that they have the right to edit.
Access to all KPIs and the linked targets is available only for users with the right 'KPI Manager'. KPI managers would have full rights for all KPIs disregarding the settings, while other users would have rights only to KPIs which settings (or category settings) allow them so.
KPI managers would have full rights for all KPIs disregarding the settings.
Rights to see or edit KPIs are managed on two levels: for a single KPI (on the form view, below the formula wizard) and for the whole category. KPI category rights and KPI own rights are combined.
There are two types of access rights: 'Read Rights' and 'Edit Rights'. 'Read Rights' lets users only observe shared KPIs. 'Edit Rights' would also allow setting and changing targets. The latter might be useful in case you ask your manager to manage goals within a department.
To give access to a particular KPI to a user or a user group:
1. Go to the tab KPIs and start creating or editing a KPI
2. Scroll down and open the tab 'Extra target security'
3. Choose users or a whole users group, that will be able to see only or edit the KPI
You can also administrate user accesses in a batch, by configuring access rights to a whole category. State people, who can read it, or edit it as you edit a KPI's category. A person or user group that has a certain right to a category, doesn't have access to its subcategories.
For example, you might want to share tasks' targets with related project users to allow them to control their fulfillment themselves. Edit rights assume sharing access to set specific targets up. For instance, you may find it a good idea to involve the sales manager in setting sub-targets for their sales team.
To give access to a particular category:
1. Go to Configuration > Categories
2. Start creating or editing a category
3. If you want some users or user groups to have access to see the category and its KPI Targets, state them in the 'Read Rights' section
4. If you want some users or user groups to have access to edit the KPI Targets of a category, state them in the 'Edit Rights' section.
By default, KPIs and the linked targets are available only for users with the right 'KPI Manager'. KPI managers would have full rights for all KPIs disregarding the settings, while other users would have rights only to KPIs which settings (or category settings) allow them so.
To assign a KPI Manager:
1. Go to Settings > Manage Users
2. Choose a particular user
3. Scroll to the section 'Productivity'
4. In the field 'KPI Management' choose the option 'KPI Manager'
Multi-Company Environment
The module supports the multi-company environment. So, if you have several companies in your Odoo environment, then you face the following peculiarities:
1. The 'Company Field' should be chosen, when a Basic measurement is created. So, when you create a Variable to calculate something within a particular company and choose the company - the module will know where to find the information
2. Basic measurements and Categories are general and seen by all companies
3. Variables, Constants, and KPIs can be either mutual (available for both companies), or company-related (only the related company will see those)
4. KPI Targets and Periods are seen only within the company, where they were created (even the general ones, which refer to the parent company)
5. The KPI Manager may only manage those KPI Targets, that refer to the manager's company. If the KPI Manager has access to several companies within the platform, then, it is possible to switch between them in the top right corner
6. Users that relate to one company, but who are given rights to KPIs or KPI Categories of another company, to which they have no access - will not be able to see such KPIs.
Configuration Page
The module has a configuration page, where you can make necessary changes to make your work convenient.
History Tolerance: define how to distinguish similar periods. For example, 7-day periods might be compared to 5-day and 9-day periods. Then, tolerance should be 2. If you have monthly or quarterly periods, you should have at least a 3-day tolerance (see KPI History and Trends).
Configure Cron Job: configure when and how frequently KPIs' actual values should be re-calculated (see KPI Targets).
KPI tags: turn on to structure KPIs by tags (see KPI Tags).
Show Help: add a special tab 'Help' to KPI objects, to get the information about those handy. For example, if enabled, you can find a 'Help' tab as you create or edit a 'Basic Measurement' with information about this type of measurement and its calculation types and settings.