About Stocks by Locations
Stocks by Locations is an Odoo module that provides essential inventory data for products at a glance and makes details by location easily reachable and clear.
The app introduces the widget for product templates, variants, and sale orders to work comfortably with stocks. The internal locations are structured hierarchically, and you may expand or hide any of them. Locations without products on hand or planned products are excluded to provide a clearer picture.
Get an instant overview of stock levels from product variant or template forms, and right from a sales line. You would have complete information over all available internal locations for quantity on hand, free-to-use quantity, reserved quantity, forecast quantity, and incoming and outgoing quants.
At a glance at products, users observe the inventories that are essential for them. So, Odoo stock levels are calculated for the default warehouse, but total inventories are still available.
Export stock levels in a single button click, right from a product form.
Expandable locations' hierarchy
User warehouse inventory levels
Inventory for products and sale lines
Excel table inventories by locations
Odoo Product Inventory Interfaces
The module aims to show inventory levels for each internal location for backend comfortable use. For that, the module introduces the widget. The widget displays a table, which gives an instant overview of stock levels from product variant or template forms, and right from a sales line. You would have complete information over all available internal locations for quantity on hand, free-to-use quantity, reserved quantity, forecast quantity, and incoming and outgoing quants.
The internal locations are structured hierarchically, and you may expand or hide any of those.
To expand the hidden warehouses, click on the 'Down Arrow' icon by the warehouse or location.
To hide the open warehouses, click on the 'Up Arrow' icon by the warehouse or location.
You can also expand all warehouses in one click. For that, find the 'Double Arrows' on the left side of the title 'Location'.
The 'Side Arrow' stands by the last location, which can no longer be expanded.
To see the stock for a specific period, specify the start and end date above the table.
Locations without products on hand or planned products are excluded to provide a clearer picture.
On the right side above the table, you can find the button 'Export to XLSX', click on it to export the stock balance table (see Stock Levels Export).

The module updates the stock balance in real-time. But, there might be some delays when there are a lot of products and warehouses. To avoid high system resource consumption, it is also possible to hide the table and show the button instead (see Stocks by Locations Configuration).
The module doesn't influence users' access rights. The access rights are regulated by Odoo or might be controlled by other third-party apps. If there are some limitations to the warehouses or locations, then users will not see them. So, the table may look different for various users.
The widget appears on:
1. Product template
2. Product variants' forms
3. Sale Order form.
Product Template
The 'Stocks by locations' widget is added to each storable and consumable product template. To see the availability of a particular product, just open the product's card, go to the Inventory tab, and find the Stock Balance by Locations section. There you will find a table, which shows the number of this product in each warehouse.
As a product is a group of variants (items) of one model, the quantity is shown for all its variants.
Click on the button 'Export to XLSX' to export the stock balance table (see Stock Levels Export).
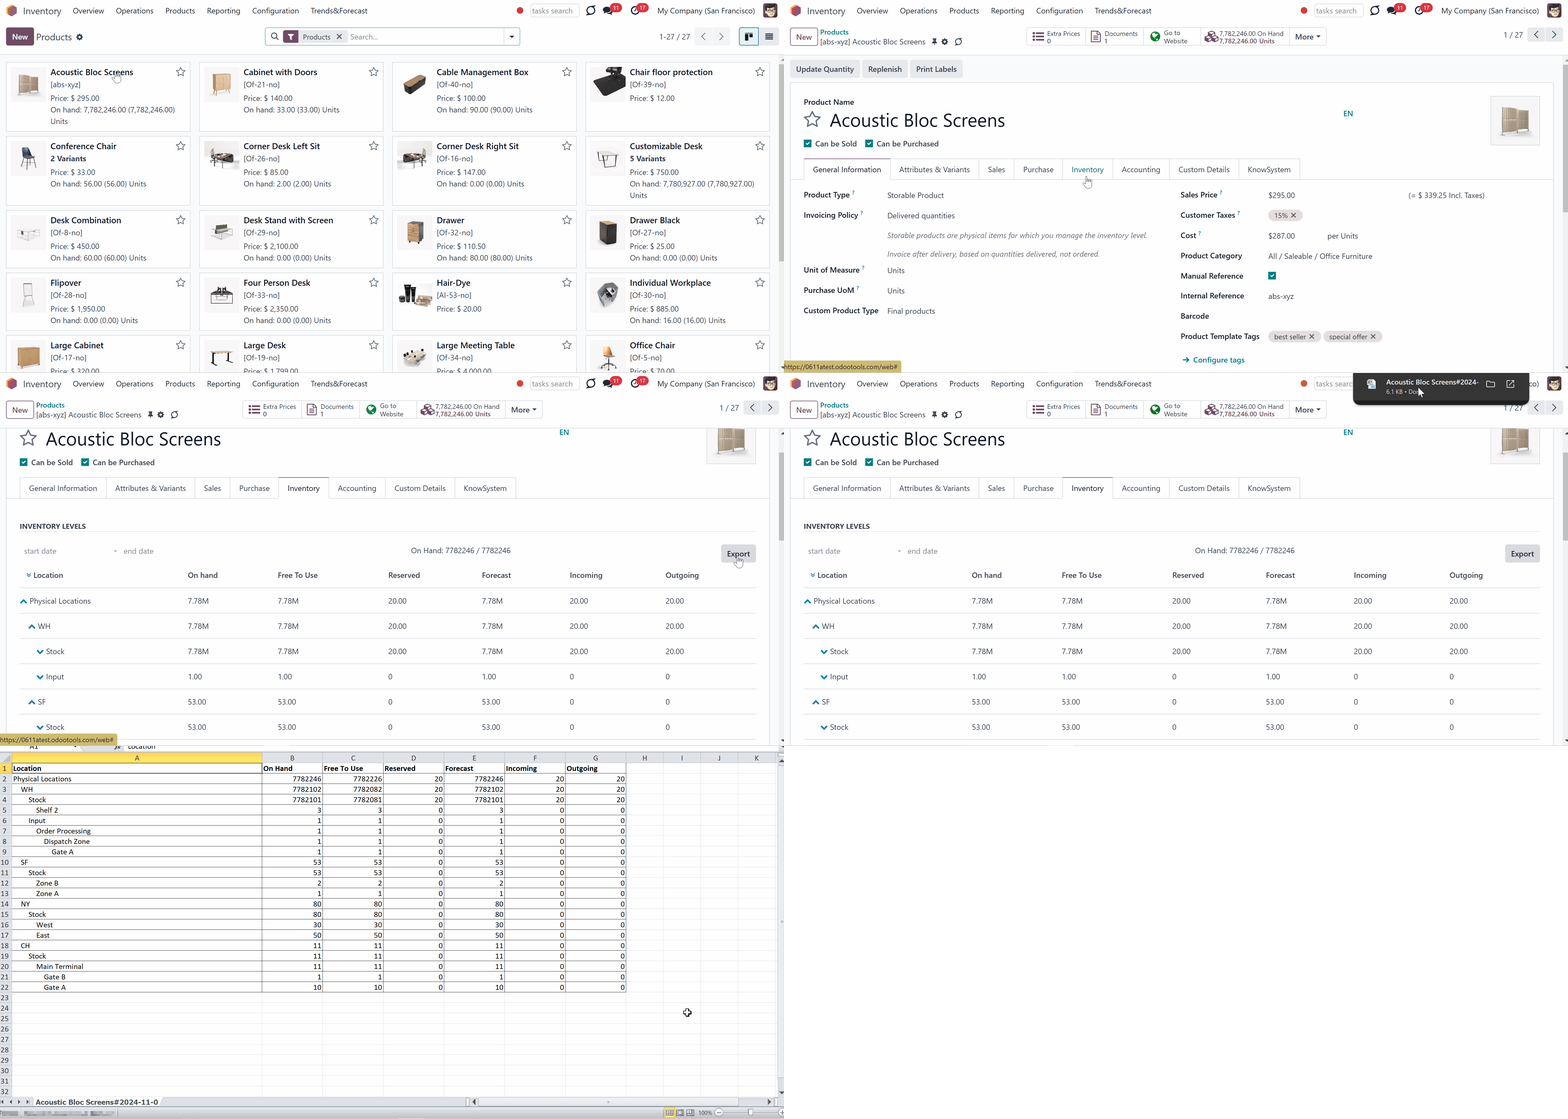
The module also changes the buttons that show the available and forecasted quantity. With the module, by default, the available and forecasted quantities are shown only in the default warehouse. Optionally, it is possible to show the available and forecasted quantity in all warehouses as well. In this case, the available/forecasted quantity in the default warehouse will be shown below (see Stocks by Location Configuration).
The available and forecasted quantities for all product variants are shown. Thus, users observe the inventories that are essential for them. However, a user can still check other warehouses using the widget 'Stocks by locations' if necessary.
The default warehouse can be configured on the user form, right under the Signature.
Here, in the picture, the user's default warehouse is 'SF'. The number in the button, which is higher, shows the total stock of all warehouses, which is 7,782,246 units. And the number below, 53 Units, shows the stocks of the 'SF' warehouse. The number in the button forecasted quantity, which is higher, shows the total forecasted product quantity by all locations, and the number below (53 Units) is the forecasted product quantity of the 'WH' warehouse.
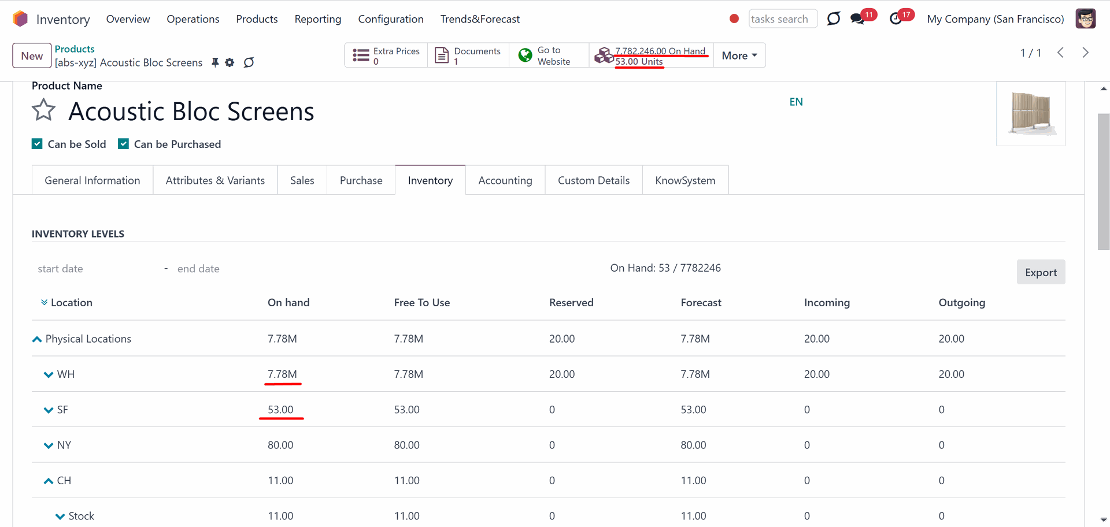
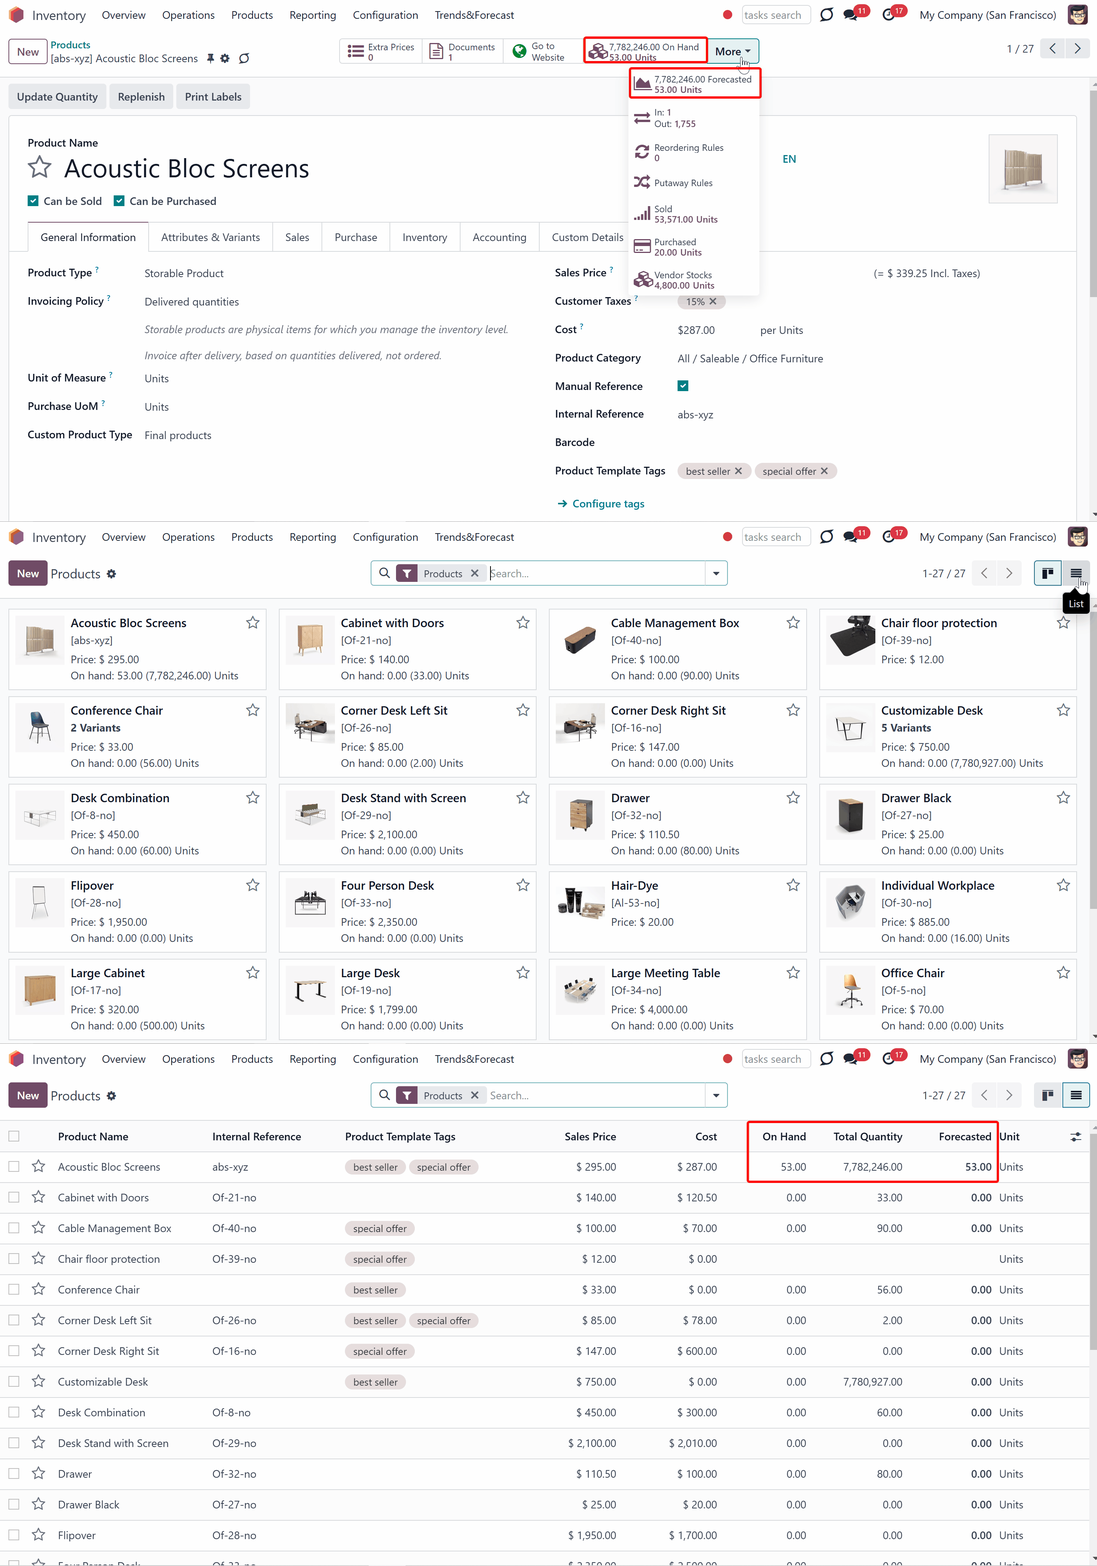
The information about the quantity of the product in the default warehouse can also be seen from both the kanban and list view of the product. The second number shows the quantity of the product in all locations.
The information about the forecasted quantity in the default warehouse can also be seen from the list view of the product.
Product Variant Form
The 'Stocks by locations' widget is added not only to the storable and consumable product's template but also to the storable and consumable product's variant forms. A product variant is a specific version of a particular product. So, it is also possible to see the quants of a specific product variant in various locations.
To see stocks of a product variant:
1. Open the product's template and click on the button 'Variants'
2. Choose a variant and open its form
3. Find the section 'Stocks by location'.
Click on the button 'Export to XLSX' to export the stock balance table (see Stock Levels Export).
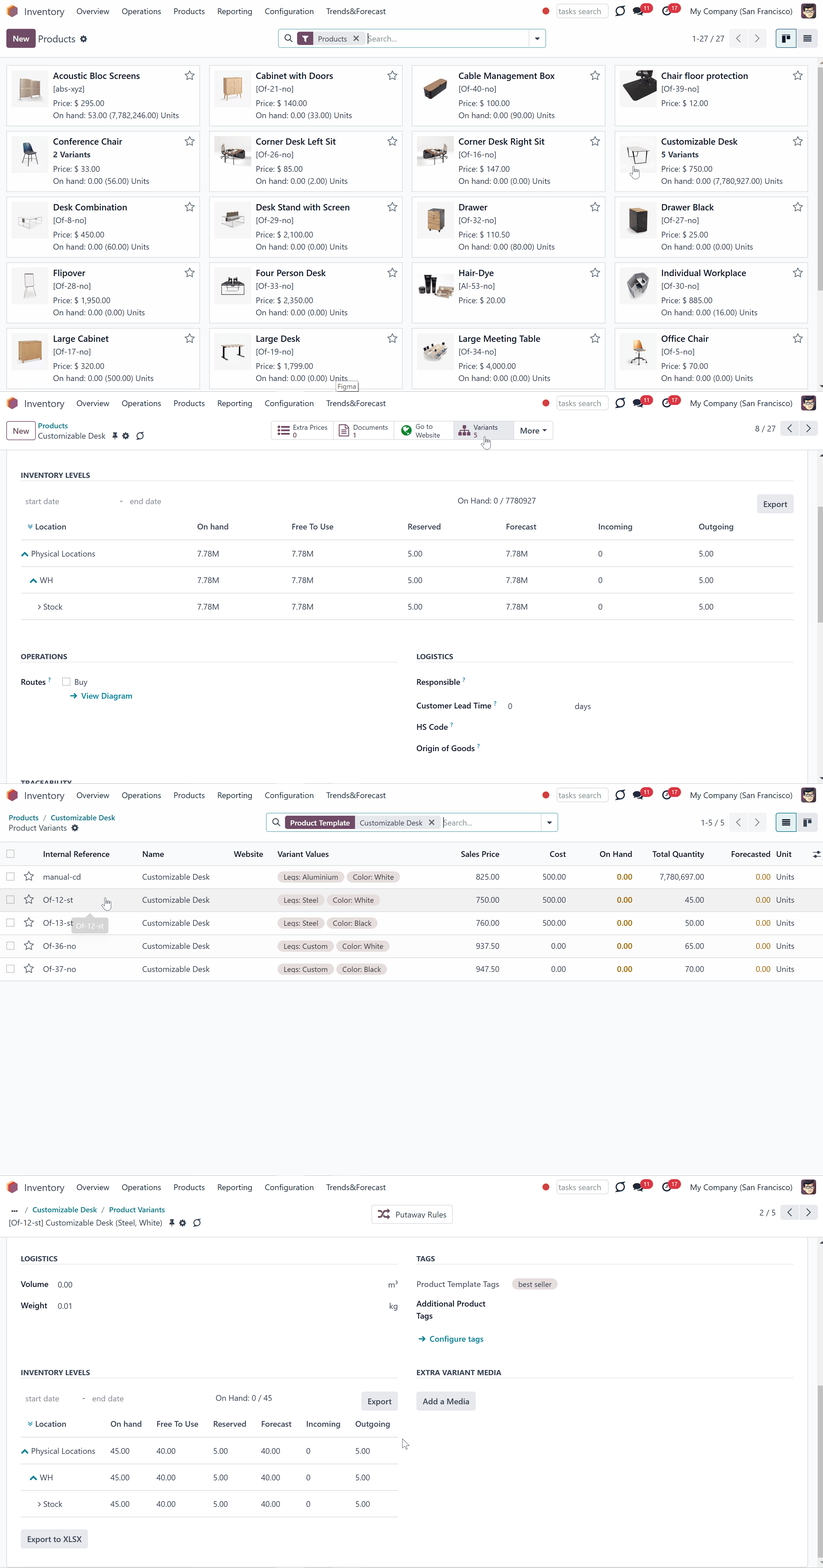
You can also open the product variant form from the product variant's menu by going to Inventory > Products > Product Variants. There, as in the product's template, you will see the buttons, which show the available quantity and the forecasted quantity of the product variant in the default warehouse. Thus, users observe the inventories that are essential for them. However, a user can still check other warehouses using the widget 'Stocks by locations' if necessary.
Here, in the picture, the user's default warehouse is 'WH'. So, the number in the button, which is lower, shows the stocks of the 'WH' warehouse, which is 0.00 Units. The number above, 7,780,697.00, shows the total stock of the product variant by all locations. The number in the button forecasted quantity, which is lower, shows the forecasted product variant's quantity of the 'WH' warehouse, which is 0.00 Units. The number above, 7,780,697.00, shows the total forecasted quantity of product variants by all locations.

The information about the quantity of the product variant in the default warehouse can also be seen from the list view in the product variant's menu. The second number shows the quantity of the product in all locations.
The information about the forecasted quantity in the default warehouse can also be seen from the list view of the product variant.

Sale Order Form
The module introduces the tool for Odoo salespersons to control inventory levels when working with quotations. With the 'Stock by locations' widget, you can get an instant overview of stock levels right from a sales line.
To see the stocks of a product from a sale order, just click on the 'Cubes' icon by the product, on the right side, after the product quantity.
The table contains complete information on all available internal locations for quantity on hand, free-to-use quantity, reserved quantity, forecast quantity, and incoming and outgoing quants.
It is possible to set the dates to check the availability of a product for a specific period.
The module helps to check the availability of a product in all locations if there isn't enough product in stock in the default location.
For example, a sale order for 10 drawers was created. However, in the default warehouse, there were only eight drawers. So, the salesperson checks the availability of the drawers in other places and suggests that the buyer wait in case the delivery takes longer.

Stock Levels Export
It is possible to export the product's stock levels. For that:
1. Open a product template or a product's variant form
2. Go to the tab 'Inventory'
3. Find the tab 'Stock balance by locations'
4. Optionally, choose the start and end date for which the stocks should be shown
5. On the right side above the table, click the button 'Export to XLSX' and the download will start automatically.
The exported document preserves the table 'Stock by Locations' structure. The hierarchy levels are presented. You see complete information over all available internal locations for quantity on hand, free-to-use quantity, reserved quantity, forecast quantity, and incoming and outgoing quants.

Stocks by Location Configuration
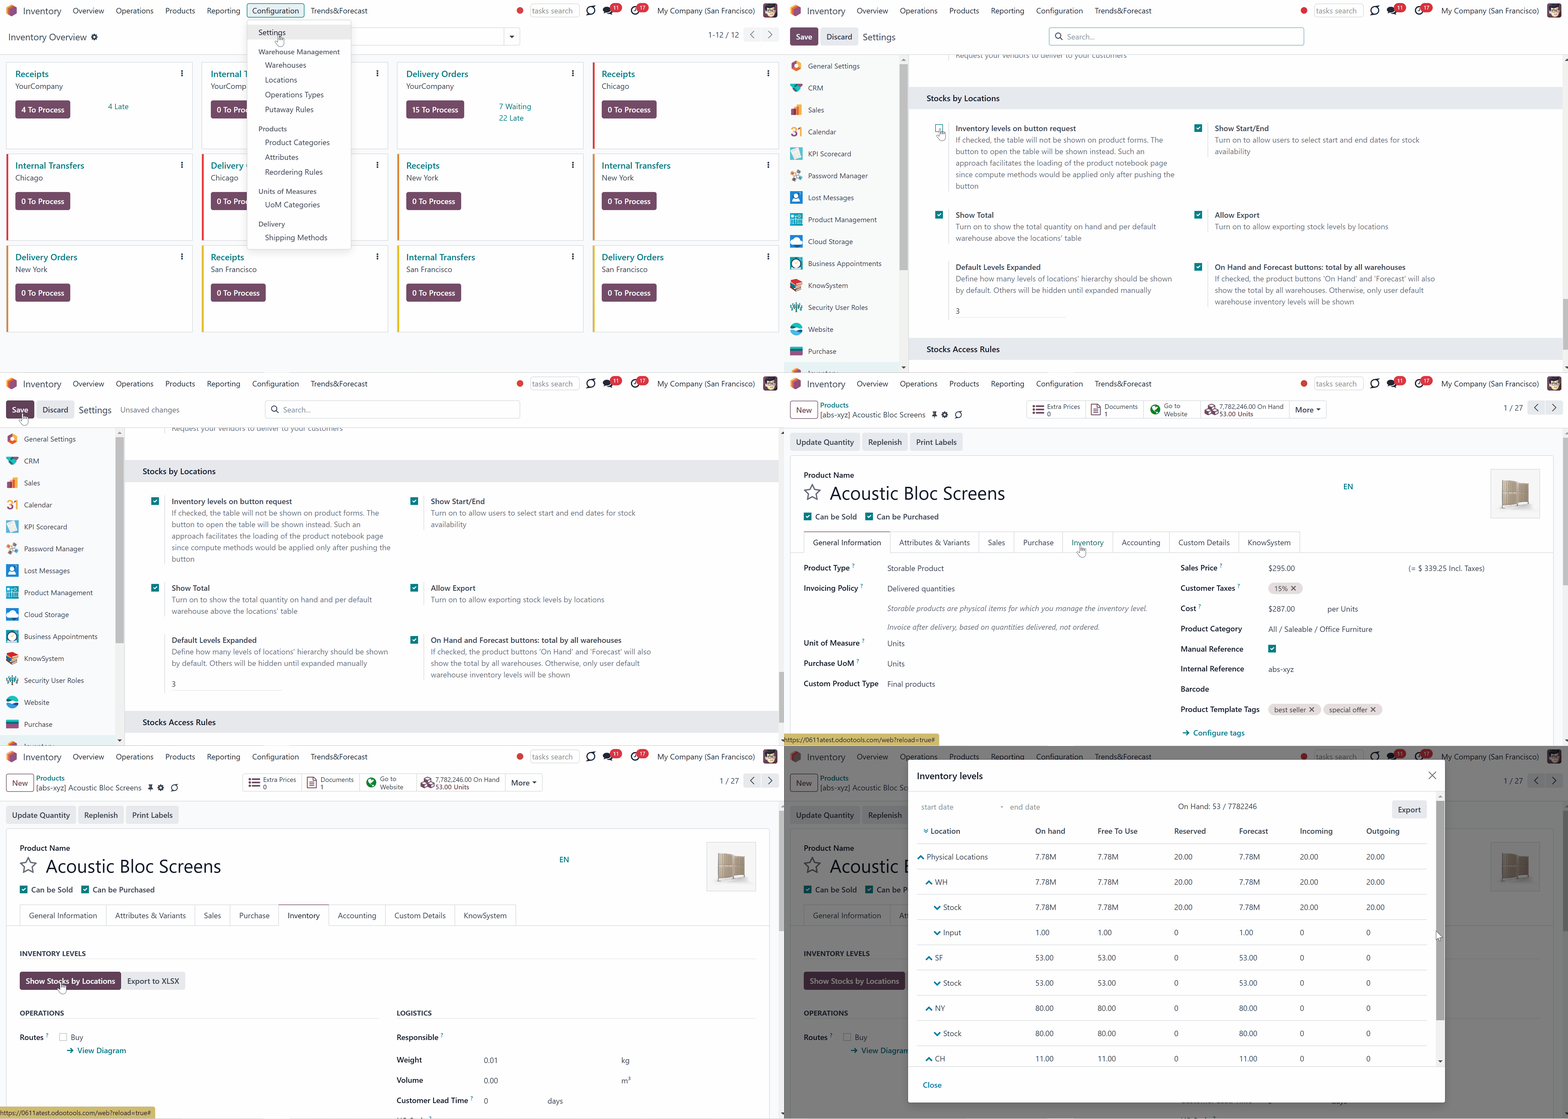
The module's tables with the product quants are updated in real-time. If you have a lot of products, warehouses, and locations, there might be some delays while opening the product's template. In this case, you can replace the table with a button. And the calculations will take place only as you click on the button.
To do this, go to Inventory > Configurations > Settings and find the section 'Stocks by locations'. There, tick the box 'Stocks by locations: the button only'.
After checking the box, the button to open the table would be shown instead of the table. Such an approach allows for facilitating the loading of product forms since the compute methods would be applied only after pushing the above button.
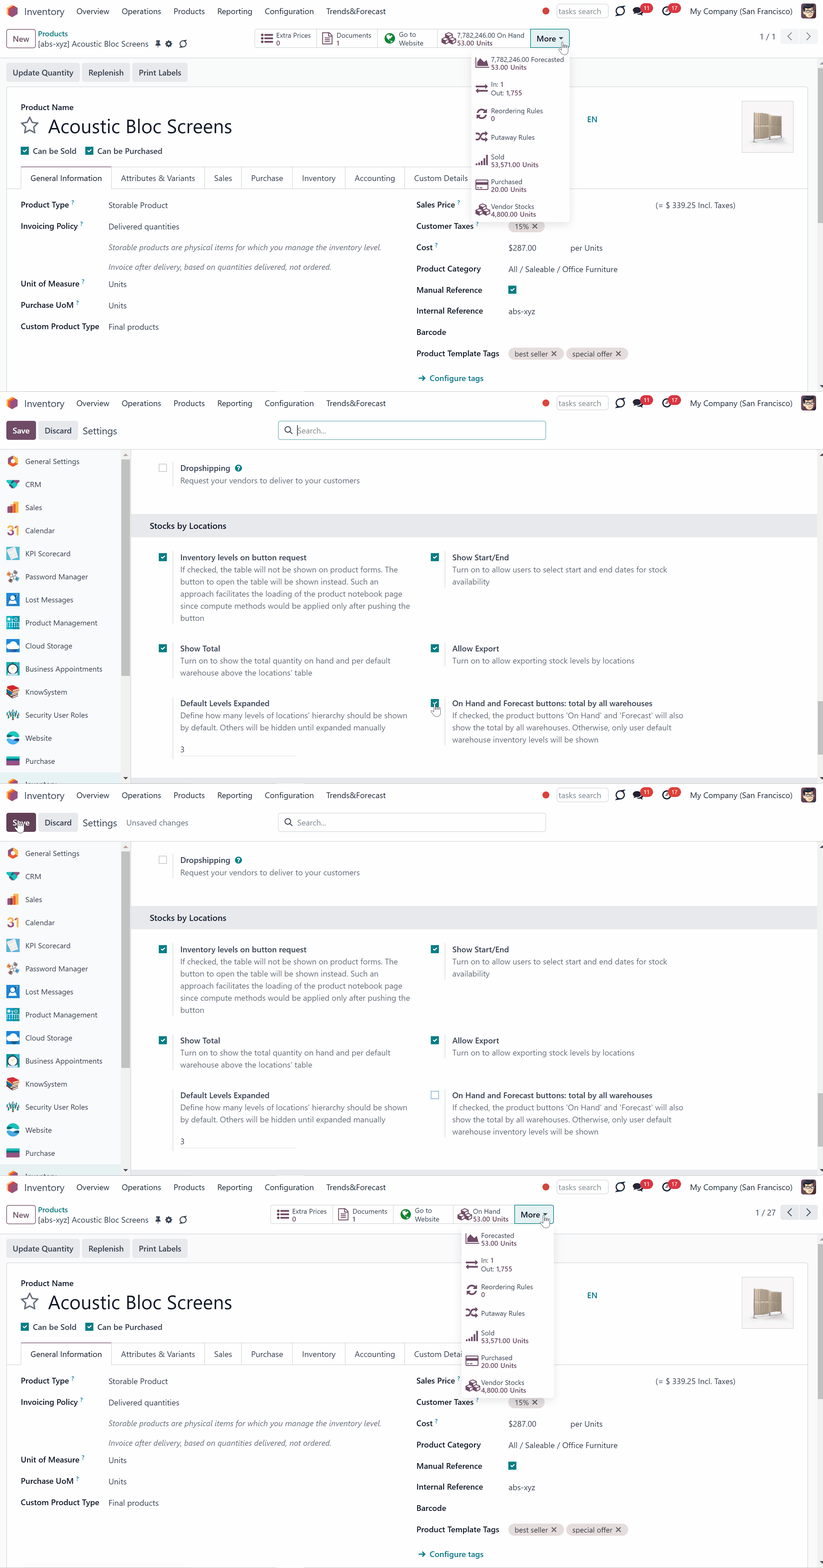
For extra convenience, it is possible to choose what to show on the buttons that show available and forecasted quantities. By default, the available and forecasted quantities are shown only in the default warehouse.
Optionally, it is possible to decide whether the available and forecasted quantities in all warehouses should be shown as well. For that, go to Inventory > Configurations > Settings and find the option 'On Hand and Forecast buttons: total by all warehouses'. If checked, the product buttons 'On Hand' and 'Forecast' will also show the total by all warehouses. Otherwise, only the user's default warehouse inventory levels will be shown.
You can specify how many levels of the locations' hierarchy will be shown by default. Others would be hidden until expanded manually.
To set the number of shown hierarchy levels, go to Inventory > Configurations > Settings and find the section 'Stocks by locations'. There, find the line default levels expanded, and type the number. For example, if you type '1', then only the first level of the locations' hierarchy will be shown by default, but users will still be able to expand to see other levels (see Interfaces).

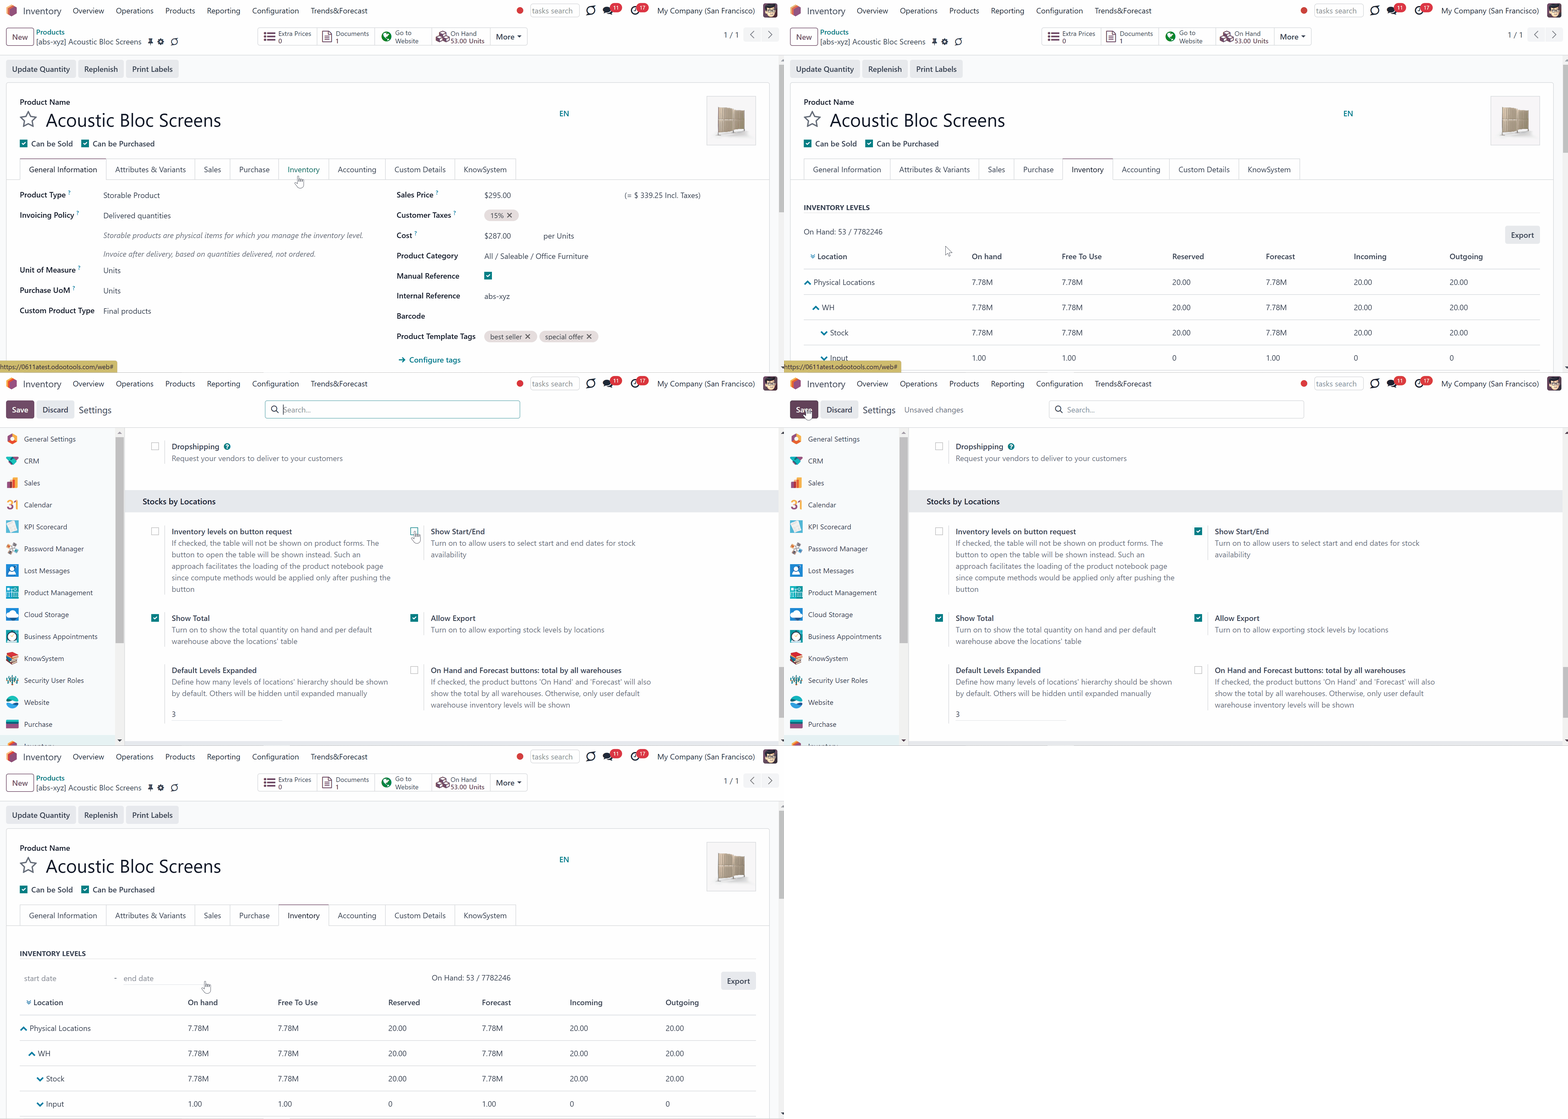
Optionally, allow users to select start and end dates for stock availability. This way, you can track the stock changes and find out the stocks for a particular period.
For that, go to Inventory > Configurations > Settings, find the section 'Stocks by locations', and enable the option 'Show Start/End'.
After that, the fields to select the dates will be shown above the stocks by locations table on the product template and product variant's cards, and as you check the stocks of a product from a sales line.
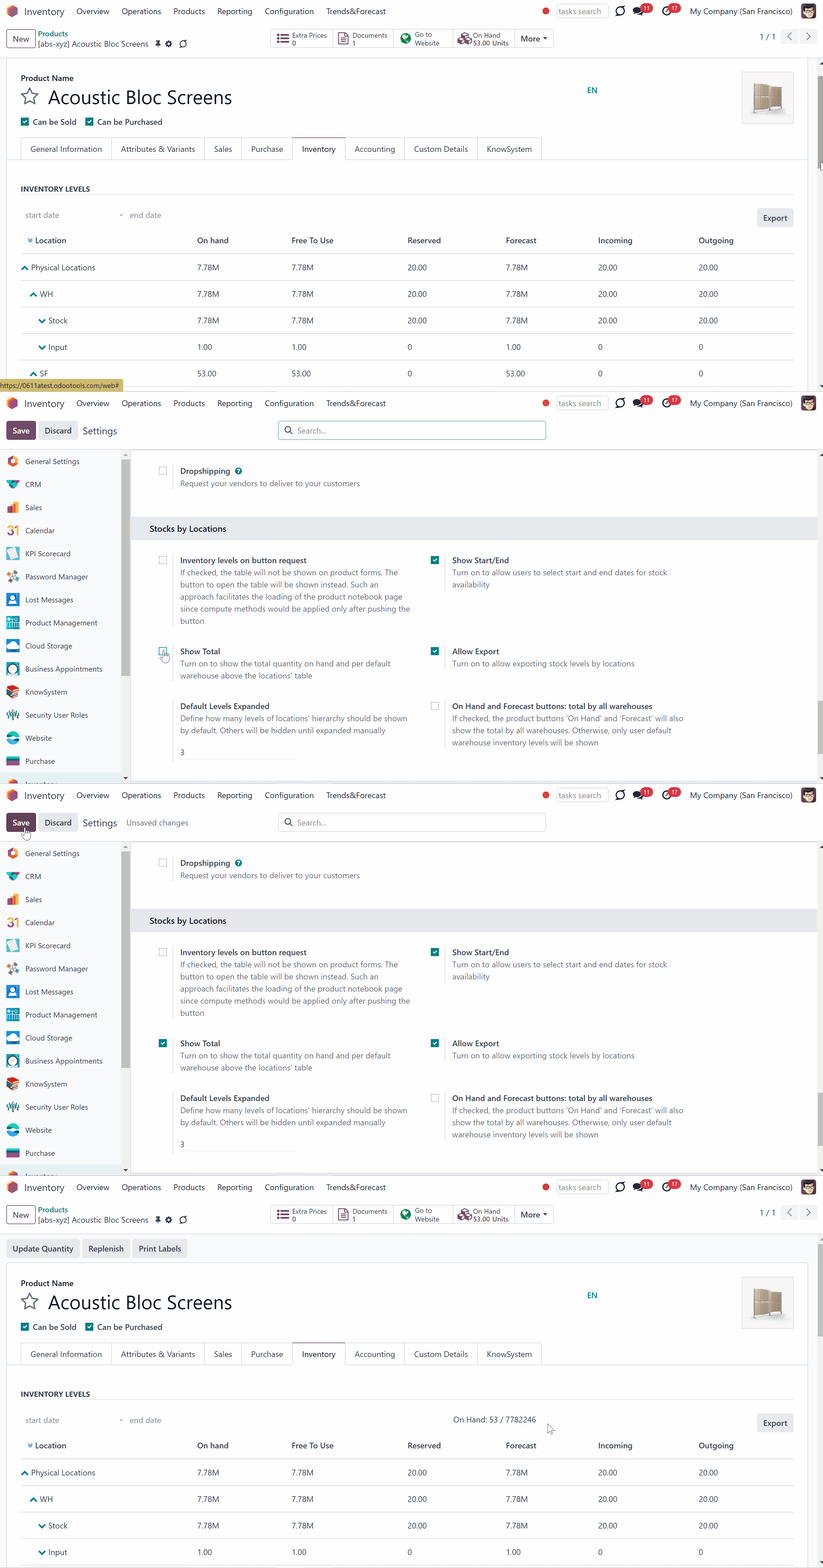
For extra convenience, add the field to show the total quantity on hand and by default warehouse above the locations' table. This way, the users will be able to get the required information quickly.
For that, go to Inventory > Configurations > Settings, find the section 'Stocks by locations', and enable the option 'Show Total'.
After that, the field will be shown above the stocks by locations table on the product template and product variant's cards, and as you check the stocks of a product from a sales line.
To allow exporting the stocks by locations table, enable the option 'Allow Export' on the configuration page.
For that, go to Inventory > Configurations > Settings, find the section 'Stocks by locations', and enable the option 'Allow Export'.
After that, the button to export the stocks will be shown above the stocks by locations table on the product template and product variant's cards, and as you check the stocks of a product from a sales line.

About Stocks by Locations
Stocks by Locations is an Odoo module that provides essential inventory data for products at a glance and makes details by location easily reachable and clear.
The app introduces the widget for product templates, variants, and sale orders to work comfortably with stocks. The internal locations are structured hierarchically, and you may expand or hide any of them. Locations without products on hand or planned products are excluded to provide a clearer picture.
Get an instant overview of stock levels from product variant or template forms, and right from a sales line. You would have complete information over all available internal locations for quantity on hand, free-to-use quantity, reserved quantity, forecast quantity, and incoming and outgoing quants.
At a glance at products, users observe the inventories that are essential for them. So, Odoo stock levels are calculated for the default warehouse, but total inventories are still available.
Export stock levels in a single button click, right from a product form.
Expandable locations' hierarchy
User warehouse inventory levels
Inventory for products and sale lines
Excel table inventories by locations
Odoo Product Inventory Interfaces
The module aims to show inventory levels for each internal location for backend comfortable use. For that, the module introduces the widget. The widget displays a table, which gives an instant overview of stock levels from product variant or template forms, and right from a sales line. You would have complete information over all available internal locations for quantity on hand, free-to-use quantity, reserved quantity, forecast quantity, and incoming and outgoing quants.
The internal locations are structured hierarchically, and you may expand or hide any of those.
To expand the hidden warehouses, click on the 'Down Arrow' icon by the warehouse or location.
To hide the open warehouses, click on the 'Up Arrow' icon by the warehouse or location.
You can also expand all warehouses in one click. For that, find the 'Double Arrows' on the left side of the title 'Location'.
The 'Side Arrow' stands by the last location, which can no longer be expanded.
To see the stock for a specific period, specify the start and end date above the table.
Locations without products on hand or planned products are excluded to provide a clearer picture.
On the right side above the table, you can find the button 'Export to XLSX', click on it to export the stock balance table (see Stock Levels Export).

The module updates the stock balance in real-time. But, there might be some delays when there are a lot of products and warehouses. To avoid high system resource consumption, it is also possible to hide the table and show the button instead (see Stocks by Locations Configuration).
The module doesn't influence users' access rights. The access rights are regulated by Odoo or might be controlled by other third-party apps. If there are some limitations to the warehouses or locations, then users will not see them. So, the table may look different for various users.
The widget appears on:
1. Product template
2. Product variants' forms
3. Sale Order form.
Product Template
The 'Stocks by locations' widget is added to each storable and consumable product template. To see the availability of a particular product, just open the product's card, go to the Inventory tab, and find the Stock Balance by Locations section. There you will find a table, which shows the number of this product in each warehouse.
As a product is a group of variants (items) of one model, the quantity is shown for all its variants.
Click on the button 'Export to XLSX' to export the stock balance table (see Stock Levels Export).

The module also changes the buttons that show the available and forecasted quantity. With the module, by default, the available and forecasted quantities are shown only in the default warehouse. Optionally, it is possible to show the available and forecasted quantity in all warehouses as well. In this case, the available/forecasted quantity in the default warehouse will be shown below (see Stocks by Location Configuration).
The available and forecasted quantities for all product variants are shown. Thus, users observe the inventories that are essential for them. However, a user can still check other warehouses using the widget 'Stocks by locations' if necessary.
The default warehouse can be configured on the user form, right under the Signature.
Here, in the picture, the user's default warehouse is 'SF'. The number in the button, which is higher, shows the total stock of all warehouses, which is 7,782,246 units. And the number below, 53 Units, shows the stocks of the 'SF' warehouse. The number in the button forecasted quantity, which is higher, shows the total forecasted product quantity by all locations, and the number below (53 Units) is the forecasted product quantity of the 'WH' warehouse.

The information about the quantity of the product in the default warehouse can also be seen from both the kanban and list view of the product. The second number shows the quantity of the product in all locations.
The information about the forecasted quantity in the default warehouse can also be seen from the list view of the product.

Product Variant Form
The 'Stocks by locations' widget is added not only to the storable and consumable product's template but also to the storable and consumable product's variant forms. A product variant is a specific version of a particular product. So, it is also possible to see the quants of a specific product variant in various locations.
To see stocks of a product variant:
1. Open the product's template and click on the button 'Variants'
2. Choose a variant and open its form
3. Find the section 'Stocks by location'.
Click on the button 'Export to XLSX' to export the stock balance table (see Stock Levels Export).

You can also open the product variant form from the product variant's menu by going to Inventory > Products > Product Variants. There, as in the product's template, you will see the buttons, which show the available quantity and the forecasted quantity of the product variant in the default warehouse. Thus, users observe the inventories that are essential for them. However, a user can still check other warehouses using the widget 'Stocks by locations' if necessary.
Here, in the picture, the user's default warehouse is 'WH'. So, the number in the button, which is lower, shows the stocks of the 'WH' warehouse, which is 0.00 Units. The number above, 7,780,697.00, shows the total stock of the product variant by all locations. The number in the button forecasted quantity, which is lower, shows the forecasted product variant's quantity of the 'WH' warehouse, which is 0.00 Units. The number above, 7,780,697.00, shows the total forecasted quantity of product variants by all locations.
The information about the quantity of the product variant in the default warehouse can also be seen from the list view in the product variant's menu. The second number shows the quantity of the product in all locations.
The information about the forecasted quantity in the default warehouse can also be seen from the list view of the product variant.
Sale Order Form
The module introduces the tool for Odoo salespersons to control inventory levels when working with quotations. With the 'Stock by locations' widget, you can get an instant overview of stock levels right from a sales line.
To see the stocks of a product from a sale order, just click on the 'Cubes' icon by the product, on the right side, after the product quantity.
The table contains complete information on all available internal locations for quantity on hand, free-to-use quantity, reserved quantity, forecast quantity, and incoming and outgoing quants.
It is possible to set the dates to check the availability of a product for a specific period.
The module helps to check the availability of a product in all locations if there isn't enough product in stock in the default location.
For example, a sale order for 10 drawers was created. However, in the default warehouse, there were only eight drawers. So, the salesperson checks the availability of the drawers in other places and suggests that the buyer wait in case the delivery takes longer.

Stock Levels Export
It is possible to export the product's stock levels. For that:
1. Open a product template or a product's variant form
2. Go to the tab 'Inventory'
3. Find the tab 'Stock balance by locations'
4. Optionally, choose the start and end date for which the stocks should be shown
5. On the right side above the table, click the button 'Export to XLSX' and the download will start automatically.
The exported document preserves the table 'Stock by Locations' structure. The hierarchy levels are presented. You see complete information over all available internal locations for quantity on hand, free-to-use quantity, reserved quantity, forecast quantity, and incoming and outgoing quants.

Stocks by Location Configuration
The module's tables with the product quants are updated in real-time. If you have a lot of products, warehouses, and locations, there might be some delays while opening the product's template. In this case, you can replace the table with a button. And the calculations will take place only as you click on the button.
To do this, go to Inventory > Configurations > Settings and find the section 'Stocks by locations'. There, tick the box 'Stocks by locations: the button only'.
After checking the box, the button to open the table would be shown instead of the table. Such an approach allows for facilitating the loading of product forms since the compute methods would be applied only after pushing the above button.

For extra convenience, it is possible to choose what to show on the buttons that show available and forecasted quantities. By default, the available and forecasted quantities are shown only in the default warehouse.
Optionally, it is possible to decide whether the available and forecasted quantities in all warehouses should be shown as well. For that, go to Inventory > Configurations > Settings and find the option 'On Hand and Forecast buttons: total by all warehouses'. If checked, the product buttons 'On Hand' and 'Forecast' will also show the total by all warehouses. Otherwise, only the user's default warehouse inventory levels will be shown.

You can specify how many levels of the locations' hierarchy will be shown by default. Others would be hidden until expanded manually.
To set the number of shown hierarchy levels, go to Inventory > Configurations > Settings and find the section 'Stocks by locations'. There, find the line default levels expanded, and type the number. For example, if you type '1', then only the first level of the locations' hierarchy will be shown by default, but users will still be able to expand to see other levels (see Interfaces).
Optionally, allow users to select start and end dates for stock availability. This way, you can track the stock changes and find out the stocks for a particular period.
For that, go to Inventory > Configurations > Settings, find the section 'Stocks by locations', and enable the option 'Show Start/End'.
After that, the fields to select the dates will be shown above the stocks by locations table on the product template and product variant's cards, and as you check the stocks of a product from a sales line.

For extra convenience, add the field to show the total quantity on hand and by default warehouse above the locations' table. This way, the users will be able to get the required information quickly.
For that, go to Inventory > Configurations > Settings, find the section 'Stocks by locations', and enable the option 'Show Total'.
After that, the field will be shown above the stocks by locations table on the product template and product variant's cards, and as you check the stocks of a product from a sales line.

To allow exporting the stocks by locations table, enable the option 'Allow Export' on the configuration page.
For that, go to Inventory > Configurations > Settings, find the section 'Stocks by locations', and enable the option 'Allow Export'.
After that, the button to export the stocks will be shown above the stocks by locations table on the product template and product variant's cards, and as you check the stocks of a product from a sales line.
